📊What Are Support and Resistance Levels? A Beginner’s Guide to Smarter Trading
Discover how to identify support and resistance levels, why they matter, and how to use them in your trading strategy. Ideal for beginners learning technical analysis.
🔍 Why Support and Resistance Matter in Trading
If you’re just getting started with trading or investing, you’ve probably come across the terms support and resistance. These are two of the most fundamental concepts in technical analysis, used by traders to forecast price movements, define entry and exit points, and manage risk effectively.
But what exactly do support and resistance levels mean? How do you spot them on a chart? And why are they so important for traders of all levels?
📈 Understanding Support and Resistance
📈 What Is Support in Trading?
A support level is a price area where an asset—like a stock, cryptocurrency, or forex pair—tends to stop falling and may reverse upward. You can think of it as a “floor” that price bounces off when it hits a low.
🧠 Why Do Support Levels Form?
- Buyer Interest: When an asset’s price drops to a certain level, it often attracts buyers who see it as a bargain. Their buying activity increases demand, which can push the price up.
- Psychological Memory: If a price bounced from a certain level in the past, traders remember it. This collective memory reinforces the idea of that price acting as support.
- Institutional Orders: Large institutional investors often place buy orders at strategic levels, strengthening the support zone.
📉 What Is Resistance in Trading?
On the flip side, a resistance level is where the price tends to stop rising and might reverse downward. Think of it as a “ceiling” that the asset struggles to break through.
🧠 Why Do Resistance Levels Form?
- Profit Taking: Traders who bought earlier may sell to lock in gains when the price reaches a certain high, increasing supply and pushing prices down.
- Psychological Barriers: Just like with support, traders remember key price levels that acted as a barrier before.
- Limit Orders: Sell orders placed at higher levels by institutions or large players also contribute to resistance.
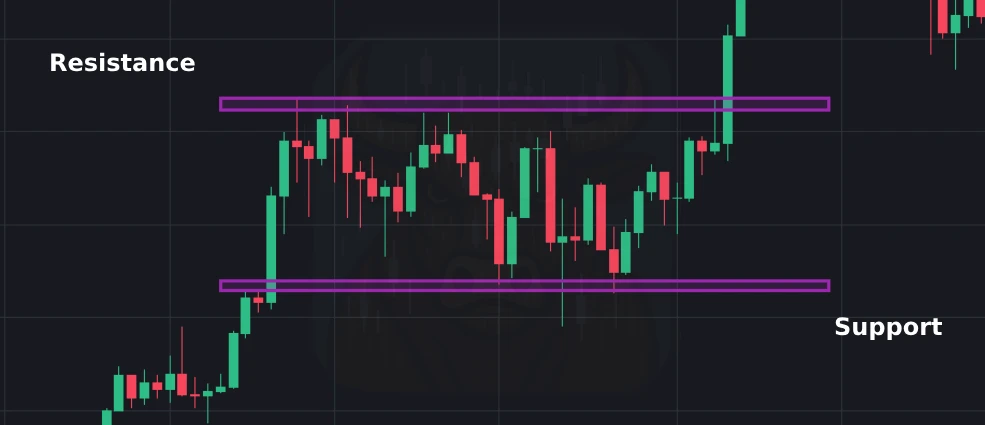
🔍 How to Identify Support and Resistance Levels
Look at past price charts and identify zones where the asset repeatedly reversed direction. The more times a level holds, the more significant it is.
Example: If a stock bounces off $50 three times, that level becomes a strong support zone.
2. 📏 Trendlines and Moving Averages
- Trendlines: Connect swing lows for support and swing highs for resistance.
- Moving Averages: Popular tools like the 50-day or 200-day MA often act as dynamic support or resistance during trends.
3. 💵 Round Numbers & Psychological Levels
Prices like $10, $50, or $100 often act as natural support or resistance, as many traders place orders around these values.
4. 🔧 Technical Indicators
- Fibonacci retracement levels
- Pivot points
- Volume profile
These tools help identify potential S/R levels with greater precision.
🎓 Why Are Support and Resistance Important?
✅ Strategic Entry & Exit
- Buy near support to catch potential rebounds.
- Sell near resistance to lock in gains before a potential pullback.
✅ Effective Risk Management
- Set stop-loss orders below support or above resistance to manage losses.
- Helps calculate risk-reward ratios with more confidence.
✅ Confirming Trend Strength
- A breakdown below support may indicate a bearish move.
- A breakout above resistance can signal the start of an uptrend.
🚨 What Happens When Support or Resistance Breaks?
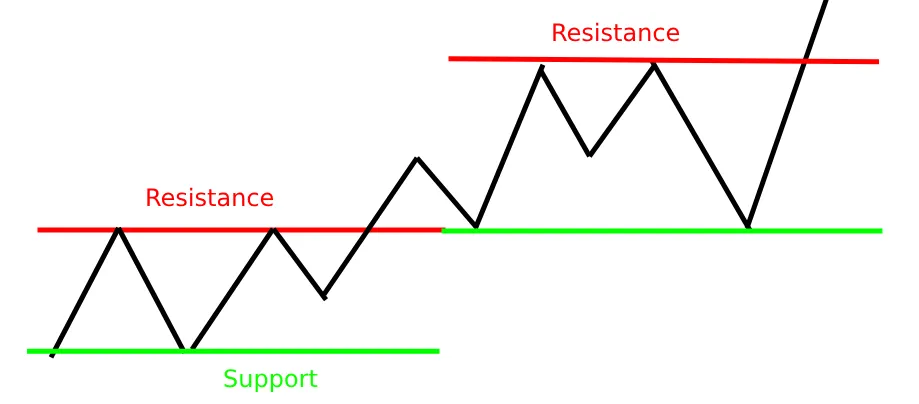
🔼 Breakout
If the price closes above a resistance level, that level often becomes new support. This can attract momentum traders.
🔽 Breakdown
If the price falls below a support level, that level may become new resistance. It could signal bearish sentiment.
⚠️ Beware of False Breakouts
Sometimes, the price moves past a level briefly before snapping back. Use volume confirmation and candle patterns to avoid getting trapped.
🎯 Trading Strategies Using Support and Resistance
1. Bounce Trading
- Buy near support when you see bullish candle patterns (e.g., hammer, engulfing).
- Sell near resistance using bearish reversal patterns (e.g., shooting star, doji).
- Stop-loss: Set just outside the S/R zone (e.g., 2–3% beyond).
2. Breakout Trading
- Enter trades when price breaks above resistance or below support.
- Confirm with:
- Volume spike (+30% above average)
- Candle close beyond the level
- Successful retest of the breakout area
🧠 Pro Tips for Using Support and Resistance Effectively
- Use multiple timeframes for confirmation (e.g., 1H, 4H, Daily).
- Combine with other indicators like RSI, MACD, or Bollinger Bands.
- Don’t rely on exact prices—treat S/R as zones, not fixed lines.
🚀 Final Thoughts
Support and resistance levels are like a trader’s GPS—they guide your decisions, help you anticipate market moves, and protect you from unnecessary risk. By learning how to recognize these levels and combine them with solid risk management, you’ll make smarter, more confident trades.
No level is foolproof, but with practice, pattern recognition, and discipline, support and resistance can become your most trusted tools in the market.
Recommended Reading
Guide to Volume Price Analysis by Anna Coulling
Technical Analysis of the Financial Markets by John J. Murphy