Trend Lines – How to Identify Market Direction Like a Pro
Learn how to draw and trade with trend lines like a pro! This guide covers uptrends, downtrends, breakouts, and common mistakes to avoid.
📈 Trend lines are one of the most powerful tools in technical analysis. They help traders spot market trends, predict potential reversals, and make smarter trading decisions. Whether you’re trading stocks, forex, or crypto, understanding trend lines can give you an edge.
In this guide, we’ll cover:
✅ What trend lines are
✅ How to draw them correctly
✅ Different types of trends (uptrend, downtrend, sideways)
✅ How to use trend lines for better entries & exits
📊 What Are Trend Lines?
A trend line is a line that connects two or more price points on a chart, showing the general direction of the market. They act like dynamic support or resistance levels, helping traders visualize trends and potential breakout points.
Why Are Trend Lines Important?
✔ Spot Trends Early – Helps identify if the market is moving up, down, or sideways.
✔ Predict Reversals – A break of a trend line can signal a trend change.
✔ Improve Entry & Exit Points – Traders buy near rising trend lines (support) and sell near falling ones (resistance).
📐 How to Draw Trend Lines Correctly
Drawing trend lines seems simple, but doing it wrong can lead to bad trades. Follow these rules:
1️⃣ Use Significant Swing Highs & Lows
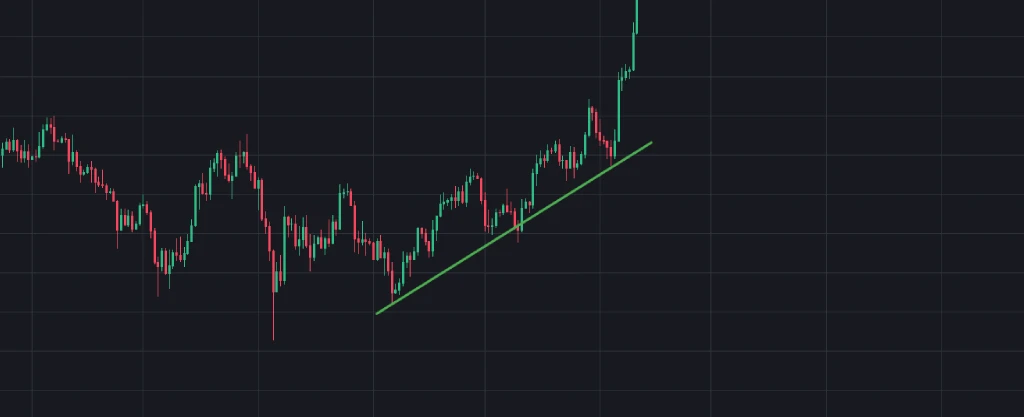
- In an uptrend, connect higher lows (the bottom of pullbacks).
- Example: Bitcoin from September to November 2024 (daily chart).
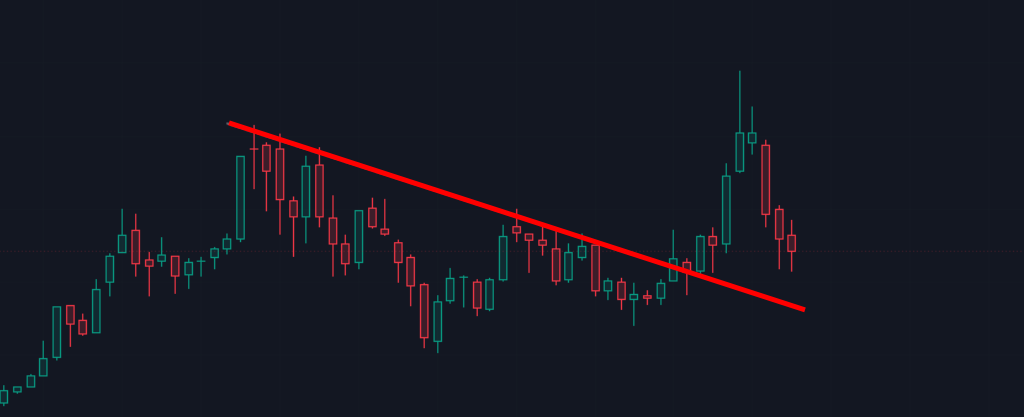
- In a downtrend, connect lower highs (the top of bounces).
- Example: Tesla from September 2022 to July 2024 (monthly chart).
- The more touches a trend line has, the stronger it is.
A good exercise would be to go to these charts and draw the lines yourself.
2️⃣ Avoid Forcing the Line
- If the line doesn’t fit naturally, the trend might not be valid.
- Don’t connect random wicks—focus on closing prices.
3️⃣ Adjust for Angle & Time Frame
- Steep trend lines break easily; shallow ones are more reliable.
- Longer time frames (daily/weekly charts) give stronger signals.
🔍 Types of Market Trends
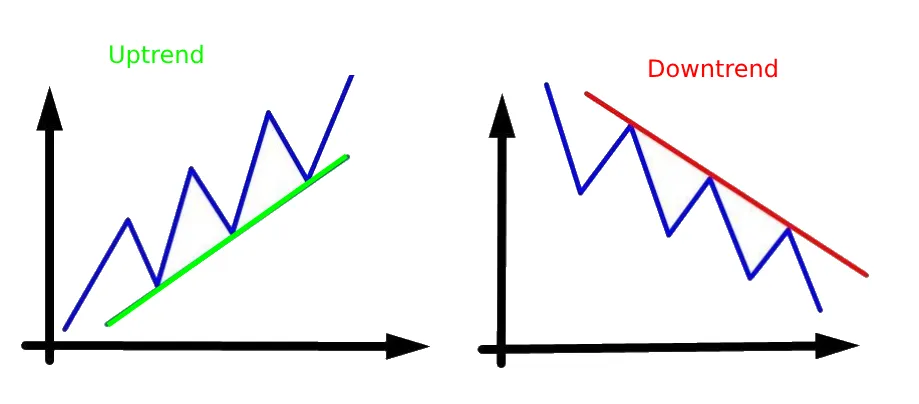
1. Uptrend (Higher Lows & Higher Highs) ↗️
- Price makes consistent higher highs (HH) and higher lows (HL).
- Trend line acts as support—buy near it for better risk-reward.
2. Downtrend (Lower Highs & Lower Lows) ↘️
- Price makes lower highs (LH) and lower lows (LL).
- Trend line acts as resistance—sell or short near it.
3. Sideways (Range-Bound) ↔️
- No clear trend—price moves between horizontal support & resistance.
- Traders buy at support and sell at resistance until a breakout happens.
🎯 How to Trade Using Trend Lines
1. Trend Line Bounce (Continuation Trade)
- Buy near an uptrend line (support) with a stop-loss below.
- Sell near a downtrend line (resistance) with a stop-loss above.
2. Trend Line Break (Reversal Trade)
- If an uptrend line breaks (support), it may signal a downtrend.
- If a downtrend line breaks (resistance), it may signal an uptrend.
- Wait for confirmation (e.g., a strong candle close beyond the line), with significant volume.
3. False Breakouts (Traps to Avoid)
- Sometimes price briefly breaks a trend line (usually with low volume). but reverses.
- Solution: Wait for a confirmed close beyond the line before acting.
💡 Pro Tips for Better Trend Line Trading
🔹 Combine with Other Indicators – Use moving averages, RSI, or volume for confirmation, Be careful with a high RSI (e.g., 70 or above).
🔹 Watch for Multiple Touches – The more times price respects a trend line, the stronger it is.
🔹 Adjust in Real Time – Trends evolve; redraw lines as new highs/lows form.
📉 Common Mistakes to Avoid
❌ Drawing Too Many Lines – Cluttered charts lead to confusion. Stick to key levels.
❌ Ignoring Time Frames – A trend on a 5-minute chart may not matter on a daily chart.
❌ Trading Against the Trend – “The trend is your friend” – don’t fight it!
🚀 Final Thoughts
Trend lines are a must-know tool for any trader. They help you:
✔ Identify trends early
✔ Find high-probability entries & exits
✔ Avoid trading against the market
Recommended Reading
Guide to Volume Price Analysis by Anna Coulling
Technical Analysis of the Financial Markets by John J. Murphy