Flags & Pennants: The Ultimate Guide to Trading Continuation Patterns
Master flags & pennants trading—learn how to identify, confirm, and profit from these high-probability continuation patterns.
🚩 Flags and pennants are among the most reliable continuation patterns in technical analysis. These short-term consolidation formations signal that an asset is pausing before continuing its prior trend—giving traders prime opportunities to enter with high probability.
In this you’ll master:
✅ What flags & pennants are (with clear visuals)
✅ Key differences between bull/bear flags vs. pennants
✅ Step-by-step trading strategies
✅ How to avoid false breakouts
🔍 What Are Flags and Pennants?
Flags and pennants are short-term continuation patterns that form after strong price movements. They represent brief consolidation before the trend resumes.
📜 Key Characteristics:
✔ Preceded by a sharp move (called the “flagpole”).
✔ Last 1-4 weeks (pennants are shorter than flags).
✔ Volume declines during formation, then spikes on breakout.
✔ Breakout typically continues the original trend.
📐 Flag vs. Pennant: What’s the Difference?
| Feature | Flag | Pennant |
|---|---|---|
| Shape | Parallel channel (sloping) | Small symmetrical triangle |
| Duration | 1-4 weeks | Few days to 2 weeks |
| Volume | Drops during formation | Drops sharply |
| Breakout | High volume continuation | High volume continuation |
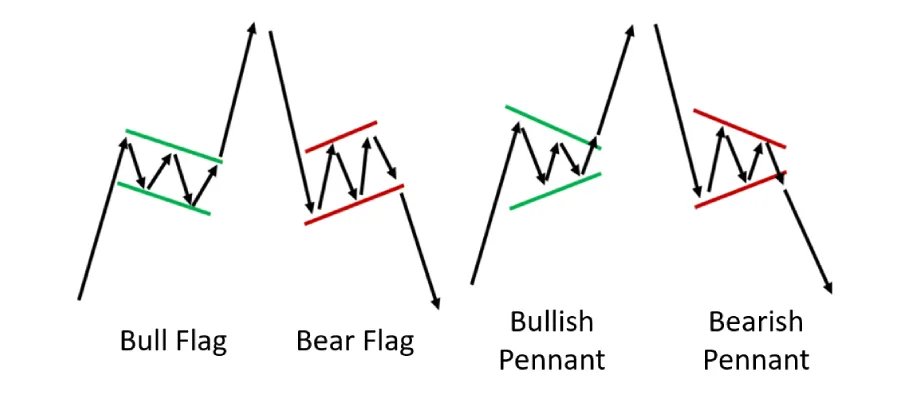
📈 Types of Flags & Pennants
1. Bullish Flag 🚀
- Forms after a strong upward move (flagpole).
- Descending channel (lower highs & lower lows).
- Breakout upside confirms trend continuation.
Trading Strategy:
- Buy above upper flag boundary.
- Stop-loss below the flag’s lowest point.
2. Bearish Flag 🐻
- Forms after a sharp decline.
- Ascending channel (higher highs & higher lows).
- Breakout downside continues the downtrend.
Trading Strategy:
- Short below lower flag boundary.
- Stop-loss above the flag’s highest point.
3. Bullish Pennant 🔼
- Forms after a vertical price rise.
- Small symmetrical triangle (converging trendlines).
- Volume collapses, then explodes on breakout.
Trading Strategy:
- Enter long on breakout with stop-loss below pennant.
4. Bearish Pennant 🔽
- Follows a violent price drop.
- Tight triangle consolidation.
- Breakdown resumes selling pressure.
Trading Strategy:
- Enter short on breakdown with stop-loss above pennant.
🎯 How to Trade Flags & Pennants (Step-by-Step)
Step 1: Identify the Flagpole
- Look for a near-vertical price move (up or down).
- Measure its height—this projects the breakout target.
Step 2: Spot the Consolidation
- Flag: Parallel channel (sloped against trend).
- Pennant: Symmetrical triangle (converging lines).
Step 3: Watch Volume
- Volume must decline during formation.
- Breakout requires volume surge for validity.
Step 4: Enter on Breakout
- Bullish: Buy when price clears upper boundary.
- Bearish: Short when price breaks lower boundary.
Step 5: Set Stop-Loss & Take Profit
- Stop-loss: Opposite side of the pattern.
- Take-profit: Flagpole height projected from breakout.
📌 Example: If flagpole = $10 rise, pennant breaks at $50 → Target = $60.
⚠️ 5 Common Mistakes to Avoid
❌ Trading Without a Flagpole – No strong prior move = invalid pattern.
❌ Ignoring Volume – Low-volume breakouts often fail.
❌ Chasing Too Late – Enter within first 1-3 bars after breakout.
❌ Misidentifying Patterns – Flags slope; pennants are symmetrical.
❌ Overlooking Timeframes – Daily/weekly flags > 5-minute ones.
🔍 Flags/Pennants vs. Other Patterns
| Pattern | Duration | Slope | Breakout Direction |
|---|---|---|---|
| Flag | 1-4 weeks | Sloping | Trend continuation |
| Pennant | <2 weeks | Symmetrical | Trend continuation |
| Triangle | Weeks-months | Various | Either direction |
| Wedge | Weeks | Converging | Usually reversal |
📌 Key Takeaways
✔ Flags slope; pennants are symmetrical triangles.
✔ Must have a preceding flagpole (strong impulsive move).
✔ Volume confirms the breakout – No volume = No trust.
✔ Measure flagpole height for targets.
✔ Works across stocks, forex, crypto.
Ready to spot these in live markets? Scan charts daily to train your eye!
Recommended Reading
Guide to Volume Price Analysis by Anna Coulling
Technical Analysis of the Financial Markets by John J. Murphy