Rectangles in Trading: Accumulation or Distribution Patterns Explained
📊 Rectangle chart patterns are essential tools in technical analysis, indicating periods of price consolidation that can precede significant breakouts. Understanding whether a rectangle pattern signifies accumulation or distribution is key to making informed trading decisions. This comprehensive guide will walk you through identifying these patterns, interpreting volume signals, and executing trades effectively.
In this you’ll learn:
✅ What rectangle patterns are
✅ Key differences between accumulation & distribution
✅ How to trade breakouts & fakeouts
✅ Real chart examples
✅ Volume’s critical role in confirmation
🔍 What Are Rectangle Patterns?
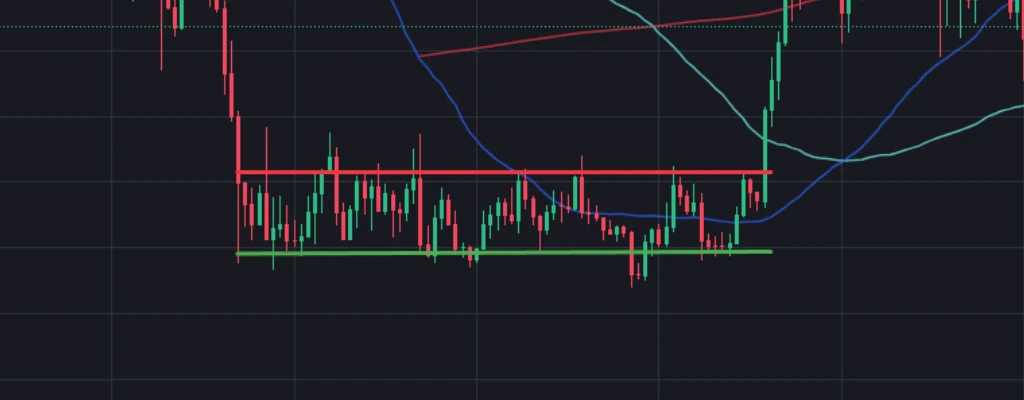
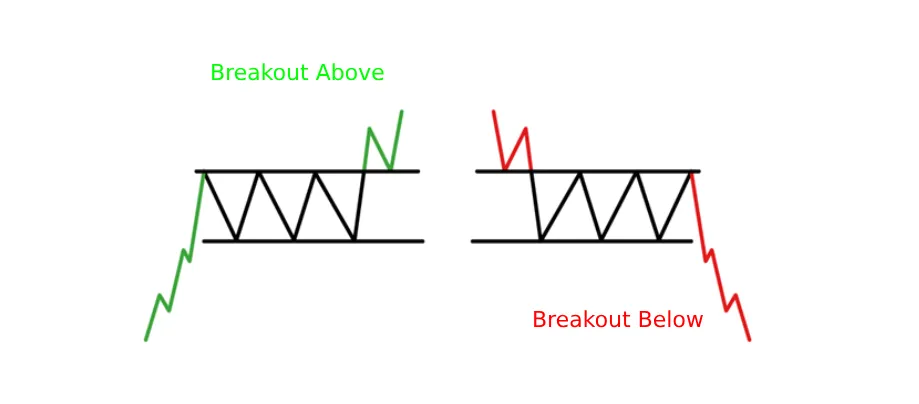
A rectangle pattern forms when price moves sideways between parallel support and resistance levels, creating a “box” on the chart. These patterns represent a battle between buyers and sellers, and their breakout direction reveals who won.
📜 Key Characteristics
✔ Parallel horizontal support & resistance
✔ Duration: Typically 2-12 weeks (longer = stronger breakout)
✔ Volume declines during consolidation, spikes on breakout
✔ Breakout direction determines if it’s accumulation or distribution
📐 Accumulation vs. Distribution: What’s the Difference?
| Feature | Accumulation Rectangle | Distribution Rectangle |
|---|---|---|
| Breakout | Upward 📈 | Downward 📉 |
| Volume | Higher on breakout | Higher on breakdown |
| Context | After downtrend | After uptrend |
| Smart Money | Institutions buying | Institutions selling |
1. Accumulation Rectangle (Bullish)
- Forms after a downtrend
- Big buyers absorb selling pressure at support
- Breakout above resistance confirms uptrend
2. Distribution Rectangle (Bearish)
- Forms after an uptrend
- Big sellers unload positions at resistance
- Breakdown below support confirms downtrend
🎯 How to Trade Rectangles (Step-by-Step)
Step 1: Identify the Rectangle
- Look for at least 2 touches on support & resistance.
- Confirm volume is declining inside the range.
Step 2: Determine Context
- Accumulation likely if:
- After downtrend
- Volume spikes on upward tests
- Distribution likely if:
- After uptrend
- Volume spikes on downward tests
Step 3: Wait for Breakout Confirmation
- Valid breakout: Closes outside the rectangle with higher volume.
- False breakout: Returns inside the range.
Step 4: Enter the Trade
- Long (accumulation): Buy above resistance, stop-loss below support.
- Short (distribution): Sell below support, stop-loss above resistance.
Step 5: Set Price Targets
- Measure the height of the rectangle
- Project same distance from breakout point
📌 Example: If rectangle height = $10, breakout at $50 → Target = $60 (or $40 for breakdown).
⚠️ 5 Common Rectangle Trading Mistakes
❌ Trading too early (before confirmed breakout)
❌ Ignoring volume (low-volume breakouts often fail)
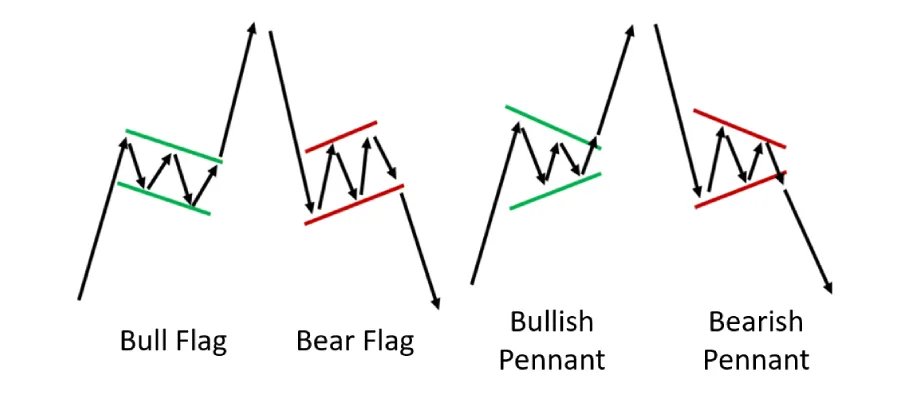
❌ Confusing with flags (rectangles are horizontal)
❌ Overlooking false breakouts (wait for close outside range)
❌ Forgetting higher timeframes (align with daily/weekly trends)
🔍 Rectangles vs. Similar Patterns
| Pattern | Trendlines | Breakout Bias | Duration |
|---|---|---|---|
| Rectangle | Horizontal | Neutral | Weeks-months |
| Flag | Sloping | Continuation | 1-4 weeks |
| Triangle | Converging | Either | Weeks |
📌 Key Takeaways
✔ Rectangles = consolidation zones (accumulation or distribution)
✔ Volume confirms breakout validity (no volume = no trust)
✔ Accumulation = After downtrend, breaks up
✔ Distribution = After uptrend, breaks down
✔ Measure height for targets (1:1 projection)
Ready to trade rectangles? Scan charts for these setups daily!
Recommended Reading
Guide to Volume Price Analysis by Anna Coulling
Technical Analysis of the Financial Markets by John J. Murphy