📊 What is MACD in Trading? The Ultimate Beginner’s Guide
If you’ve ever looked at a trading chart and wondered how professionals spot trend changes early, the MACD indicator is one of their secret weapons. But what exactly is MACD, and how can you use it to improve your trading?
In this comprehensive guide, we’ll break down:
✅ What MACD is and why traders swear by it
✅ How to read the MACD histogram and signal line
✅ 3 powerful MACD trading strategies
✅ Common mistakes to avoid
✅ How to combine MACD with other indicators
By the end, you’ll understand how to use MACD like a pro trader. Let’s dive in!
🔍 “What is MACD? (Short Answer)”
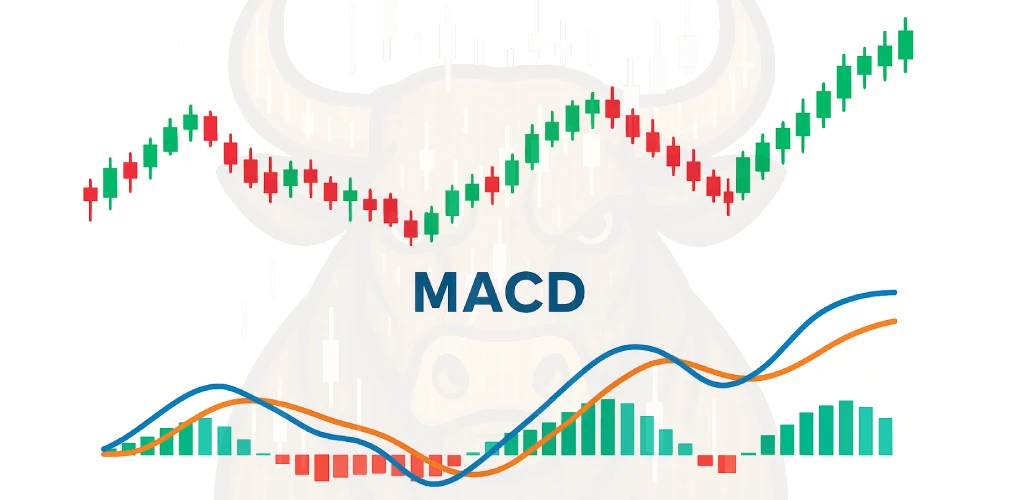
MACD (Moving Average Convergence Divergence) is a momentum indicator that helps traders identify trend direction and potential reversals. It consists of the MACD line, signal line, and histogram.
📌 Created by: Gerald Appel in the late 1970s
📌 Best for: Spotting trend direction, momentum, and potential reversals
📌The 3 Key Components of MACD:
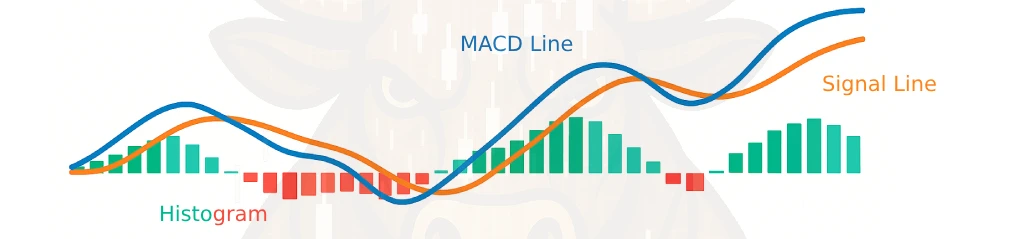
1️⃣ MACD Line (12-day EMA – 26-day EMA)
2️⃣ Signal Line (9-day EMA of MACD Line)
3️⃣ Histogram (Visual representation of the distance between MACD & Signal Line)
📈 How to Read MACD (With Examples)
1️⃣ MACD Line Crosses Signal Line
- Bullish Signal: When MACD crosses ABOVE Signal
- Bearish Signal: When MACD crosses BELOW Signal
2️⃣ MACD Centerline Cross
- Above 0: Bullish momentum
- Below 0: Bearish momentum
3️⃣ Divergence Trading
- Price makes higher highs but MACD makes lower highs? → Potential reversal coming
- Price makes lower lows but MACD makes higher lows? → Possible upward reversal
💡 3 Powerful MACD Trading Strategies
1️⃣ The Classic Crossover Strategy
- Buy Signal: MACD crosses above Signal Line
- Sell Signal: MACD crosses below Signal Line
- Best for: Swing trading (1hr-4hr charts)
2️⃣ Zero Line Bounce Strategy
- Buy: When MACD crosses above 0 line
- Sell: When MACD crosses below 0 line
- Works great for: Trend confirmation
3️⃣ Divergence Hunting
- Find mismatches between price and MACD
- Requires practice but offers high-reward setups
⚠️ 5 Common MACD Mistakes to Avoid
❌ Trading crossovers in ranging markets (leads to whipsaws)
❌ Ignoring the overall trend (always trade in the trend’s direction)
❌ Using default settings for all timeframes (adjust for day trading vs investing)
❌ Relying solely on MACD (combine with RSI or support/resistance)
❌ Chasing every crossover (wait for confirmation)
🔧 How to Adjust MACD Settings
| Trading Style | Recommended Settings |
|---|---|
| Scalping | (5,13,1) Faster signals |
| Day Trading | (12,26,9) Standard |
| Swing Trading | (21,52,9) Smoother |
| Long-term Investing | (24,52,9) Less noise |
💡 Pro Tip: Test new settings in a demo account first!
🏆 MACD vs Other Indicators
| Indicator | Best For | Works Well With MACD? |
|---|---|---|
| RSI | Overbought/oversold | ✅ Yes (confirmation) |
| Bollinger Bands | Volatility | ✅ Yes (for breakout confirmation) |
| Moving Averages | Trend direction | ✅ Yes (perfect combo) |
| Stochastic | Momentum | ❌ Can be redundant |
❓ MACD Trading FAQs
❔ What’s better: MACD or RSI?
MACD is better for trend following, RSI for overbought/oversold – use together!
❔ Can MACD be used for crypto trading?
Yes, but crypto’s volatility means you should:
- Use higher timeframes (4H+)
- Combine with volume indicators
❔ Why does my MACD give false signals?
All indicators lag – always confirm with:
✔ Price action
✔ Support/resistance
✔ Volume
❔ What’s the best timeframe for MACD?
Depends on your strategy:
- Day traders: 15min-1hr
- Swing traders: 4hr-daily
- Investors: Weekly
🚀 Advanced MACD Techniques
1️⃣ Multiple Timeframe Analysis
Check MACD on higher timeframe for trend direction
2️⃣ Hidden Divergence Trading
Find continuation patterns within trends
3️⃣ MACD Histogram Momentum
Fading histogram peaks can predict reversals
📌 Key Takeaways
✔ MACD measures trend strength and momentum
✔ Crossovers, zero line breaks, and divergences are key signals
✔ Combine with other indicators for better accuracy
✔ Adjust settings based on your trading style
✔ Avoid trading MACD alone – always confirm with price action
💬 Final Thoughts
The MACD indicator is one of the most versatile tools in a trader’s toolkit. Whether you’re trading stocks, forex, or crypto, understanding MACD can give you a significant edge in spotting high-probability setups.
💡 “Ready to master MACD? Bookmark this guide and start testing these strategies on your charts today!”
Recommended Reading
Guide to Volume Price Analysis by Anna Coulling
Technical Analysis of the Financial Markets by John J. Murphy