📊 What Are Bollinger Bands? The Complete Trading Guide for Beginners
Did you know that 90% of professional traders use this simple tool to spot explosive market moves? Bollinger Bands might look like just three lines on your chart, but when you understand how they really work, they can reveal hidden opportunities most traders miss.
In this comprehensive guide, we’ll break down:
✅ What Bollinger Bands are and why they’re so powerful
✅ The exact math behind the bands (simplified)
✅ 3 proven Bollinger Bands strategies anyone can use
✅ How to spot overbought/oversold conditions correctly
✅ Common mistakes that cost new traders money
🔍 What Are Bollinger Bands?
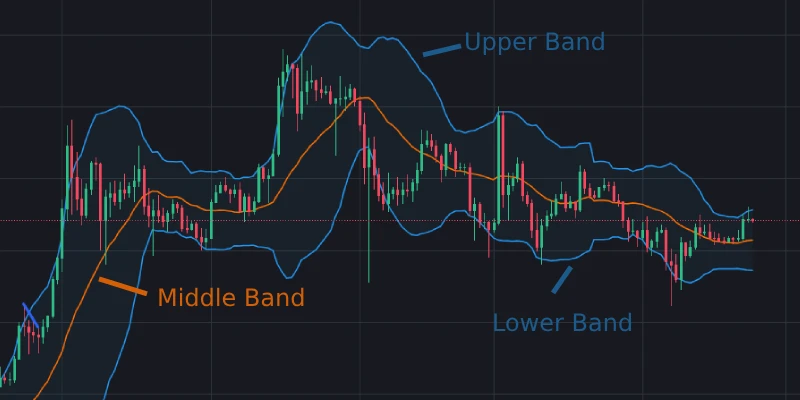
Created by John Bollinger in the 1980s, Bollinger Bands are a volatility indicator that forms a dynamic “envelope” around price. They consist of:
- Middle Band: 20-period Simple Moving Average (SMA)
- Upper Band: SMA + (2 × Standard Deviation)
- Lower Band: SMA – (2 × Standard Deviation)
📌 Key Features:
- Adjust automatically to market volatility
- Work on any timeframe (1min to monthly)
- Effective for stocks, forex, and crypto
Why Traders Love Them:
✔ Visualize volatility (bands widen/narrow)
✔ Spot overextended prices (touches upper/lower bands)
✔ Identify trend strength (price riding a band)
🧮 How Bollinger Bands Are Calculated
Let’s break down the math (don’t worry – it’s simpler than it looks!):
1️⃣Calculate 20-day SMA
- Add last 20 closing prices ÷ 20
2️⃣Find Standard Deviation
- Measures how spread out prices are from average
3️⃣Plot Upper/Lower Bands
- Upper: SMA + (2 × SD)
- Lower: SMA – (2 × SD)
📊 Example: If SMA = $100 and SD = $5:
- Upper Band = $100 + (2 × $5) = $110
- Lower Band = $100 – (2 × $5) = $90
💡 Pro Tip: Most platforms calculate this automatically. Focus on interpretation, not calculation!
📈 How to Use Bollinger Bands: A Beginner’s Guide to Reading the Bands
1️⃣ The Squeeze (Volatility Signal)
- Bands tighten = Low volatility → Big move coming
- Bands widen = High volatility → Trend continuation
2️⃣ Band Touches
- Upper Band Touch: Potential overbought (not always!)
- Lower Band Touch: Potential oversold (not always! x2)
3️⃣ Price Position
- Riding Upper Band: Strong uptrend
- Riding Lower Band: Strong downtrend
- Middle Band: Often acts as support/resistance
💼 3 Bollinger Bands Strategies That Actually Work
1️⃣ The Classic Reversal Strategy
- Buy when price hits lower band + RSI < 30
- Sell when price hits upper band + RSI > 70
- Best for: Range-bound markets
2️⃣ The Momentum Rider
- Go long when price breaks above middle band in uptrend
- Go short when price breaks below middle band in downtrend
- Best for: Trend-following traders
3️⃣ The Squeeze Breakout
- Wait for bands to tighten (squeeze)
- Enter when price breaks band with volume
- Ride the new trend
- My personal favorite for crypto trading!
⏳ Best Timeframes for Bollinger Bands
| Trading Style | Ideal Timeframe | Why? |
|---|---|---|
| Scalping | 1-5 min | Works but can be noisy |
| Day Trading | 15 min-1H | Balanced signals |
| Swing Trading | 4H-Daily | Sweet spot for reliability |
| Investing | Weekly | Identifies major turns |
⚠️ Warning: On very short timeframes (under 5min), you’ll get many false signals.
⚠️ 5 Costly Bollinger Bands Mistakes
❌ Trading every band touch (Works only 40% of time alone)
❌ Ignoring the trend (Band touches mean different things in trends vs ranges)
❌ Using default settings for everything (Adjust for volatile assets)
❌ Forgetting volume (Breakouts need volume confirmation)
❌ Using just Bollinger Bands (Always combine with RSI/MACD)
🔄 Bollinger Bands vs Other Indicators
| Indicator | Measures | Bollinger Advantage |
|---|---|---|
| Keltner Channels | Volatility | Bollinger Bands more responsive |
| Envelopes | Fixed % bands | Bollinger adapts to volatility |
| ATR | Pure volatility | Bollinger shows price context |
💡 Smart Combo: Bollinger Bands + Volume + MACD = Killer system
❓ Bollinger Bands FAQs
Stick with (20,2) for most cases. For crypto, some traders use (20,2.5).
Yes, especially on major pairs like EUR/USD during London/NY sessions.
No indicator can – they show probabilities. Always use stop losses!
Some platforms use slightly different SD calculations. Pick one and stay consistent.
Developed in 1983 – still widely used because volatility never goes out of style.
📌 Key Takeaways
✔ Bollinger Bands measure volatility through dynamic bands
✔ The squeeze often precedes big moves
✔ Band touches don’t always mean reversals (context matters!)
✔ Best combined with other indicators
✔ Works across all markets and timeframes
🚀 Next Steps: How to Start Using Bollinger Bands Today
- Open your trading platform and add Bollinger Bands
- Analyze past trades – would bands have helped?
- Paper trade the 3 strategies above
- Combine bands with your existing system
Bollinger Bands might just become your new favorite tool – happy trading! 📈✨
Recommended Reading
Guide to Volume Price Analysis by Anna Coulling
Technical Analysis of the Financial Markets by John J. Murphy