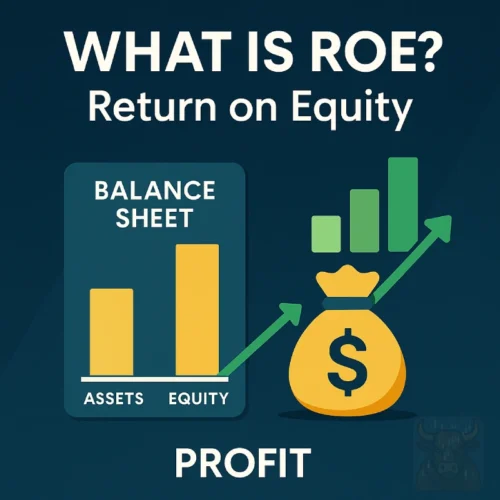
📈 What is ROE (Return on Equity)? The Investor’s Guide to Measuring Profitability

Did you know Warren Buffett’s Berkshire Hathaway maintains an ROE above 20% – nearly double the S&P 500 average? That’s no accident. ROE is the silent metric that separates market-crushing companies from mediocre ones, yet most investors don’t know how to use it properly.
In this comprehensive guide, you’ll discover:
✅ How to calculate ROE in 30 seconds (even if you hate math)
✅ Why a “good” ROE differs wildly by industry
✅ The hidden red flag when ROE is too high
✅ 3 professional ROE analysis techniques
“I once bought a stock with 40% ROE thinking it was a goldmine – turns out they were drowning in debt. Here’s how to avoid my mistake.”
💡 What is Return on Equity (ROE)?
ROE measures how effectively a company generates profits from shareholders’ investments. Think of it as a “management report card” – it answers:
“For every dollar shareholders invest, how much profit does the company create?”
📌 Key Components:
- Net Income (Profit after all expenses)
- Shareholders’ Equity (Assets – Liabilities)
Why ROE Matters:
✔ Identifies efficient profit generators
✔ Helps compare companies in same industry
✔ Reveals management effectiveness
🧮 How to Calculate ROE (With Real Example)
The ROE Formula:
ROE = (Net Income / Shareholders' Equity) × 100Step-by-Step:
- Find net income on the income statement
- Locate shareholders’ equity on the balance sheet
- Divide net income by shareholders’ equity
- Multiply by 100 to get percentage
📊 Apple Example (2023):
- Net Income: $99.8 billion
- Shareholders’ Equity: $62.1 billion
- ROE = (99.8/62.1) × 100 = 160.7%
Wait – 160%?! Yes, but we’ll explain why this is misleading later.
💡 Pro Tip: All financial sites (Yahoo Finance, Bloomberg) calculate this automatically – focus on interpretation.
📊 How to Interpret ROE Values
| ROE Range | Interpretation | What It Means |
|---|---|---|
| <10% | Poor | Inefficient or struggling |
| 10-15% | Average | Typical for many stable companies |
| 15-20% | Good | Above-average management |
| >20% | Excellent | Exceptional performers |
| >40% | Potential Red Flag | Often debt-fueled |
⚠️ Critical Insight: A 5% ROE might be great for utilities but terrible for tech.
🏭 ROE by Industry Benchmarks
| Industry | Typical ROE Range | Why? |
|---|---|---|
| Technology | 15-25% | High margins, low assets |
| Banks | 10-15% | Highly regulated |
| Utilities | 8-12% | Capital-intensive |
| Consumer Staples | 15-20% | Stable demand |
“I learned this the hard way comparing a 12% ROE bank to a 18% ROE tech stock – apples to oranges!”
🔍 3 Advanced ROE Analysis Techniques
1️⃣ The DuPont Formula (ROE Breakdown)
Decomposes ROE into three drivers:
ROE = (Net Profit Margin) × (Asset Turnover) × (Equity Multiplier)- Shows whether ROE comes from margins, efficiency, or leverage
2️⃣ 5-Year ROE Trend
- Rising ROE = Improving efficiency
- Falling ROE = Potential trouble ahead
3️⃣ ROE vs. Cost of Equity
- ROE > Cost of Equity = Creating value
- ROE < Cost of Equity = Destroying value
⚠️ 5 ROE Pitfalls to Avoid
❌ Comparing across industries (Tech vs utilities = meaningless)
❌ Ignoring debt levels (High leverage inflates ROE)
❌ One-year snapshots (Look for consistency)
❌ Overlooking share buybacks (Artificially boosts ROE)
❌ Ignoring cash flow (Earnings can be manipulated)
That 160% ROE for Apple? Mostly from massive buybacks reducing equity – not actual performance.
📈 ROE vs Other Profitability Metrics
| Metric | Measures | Best For | ROE Comparison |
|---|---|---|---|
| ROA | Profit per asset dollar | Asset-heavy firms | Ignores leverage |
| ROIC | Profit on all invested capital | Capital efficiency | More comprehensive |
| Gross Margin | Production efficiency | Cost analysis | Doesn’t account for equity |
💡 Smart Investor Move: Use ROE + ROIC together for full picture.
❓ ROE FAQs
10-15% is solid – higher may mean they’re skimping on dividends.
Yes – when net income is negative (big red flag).
They require less physical assets (lower equity denominator).
Quarterly, but focus on long-term trends.
No – most lack traditional financial statements.
📌 Key Takeaways
✔ ROE measures profit per equity dollar
✔ 15%+ is generally strong (varies by industry)
✔ Always check debt levels (leverage distorts ROE)
✔ Compare to industry peers, not overall market
✔ Use with ROIC/ROA for best insights
🚀 Your Action Plan
- Today: Calculate ROE for your top 3 holdings
- This Week: Compare to industry averages
- Next Month: Analyze 5-year trends
- Ongoing: Screen for stocks with ROE >15% + low debt
This is the ROE masterclass I wish I had when I started investing. Now go find those high-quality companies! 📊🚀


