📈 Technical Analysis for Beginners: Charts, Patterns & Indicators Explained
“Learn technical analysis basics step-by-step. Includes chart types, indicators like RSI & MACD, real examples, and strategies for beginners.”
Let’s explore technical analysis in depth, from the basics to advanced strategies. This is the preferred method for traders making short-to-medium-term decisions.
🔍 1. What Is Technical Analysis? Key Principles Explained
Core Principles:
- Price discounts everything: All factors (fundamentals, news, psychology) are already reflected in price.
- Prices move in trends: “The trend is your friend” until proven otherwise.
- History repeats itself: Past patterns tend to recur due to market psychology.
📊 2. Core Tools in Technical Analysis (Charts, Trends, Indicators)
A. Charts: The 3 Main Types
- Line charts: Shows only closing prices
- Bar charts: Includes open, high, low, and close (OHLC)
- Candlestick charts: Most popular, reveals market emotions
We’ll use japanese candlestick charts for the examples, since they’re the most useful in my opinion and the ones I’m most familiar with.
Practical example:
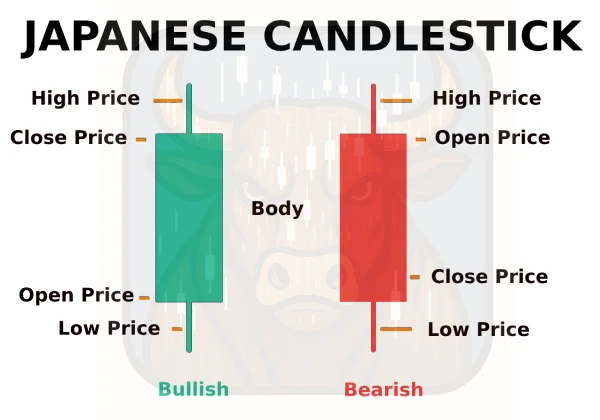
Green candle (bullish):
- Close > Open
- Large body = strong buying conviction

Red candle (bearish):
- Close < Open
- Long upper wick = rejection at highs
B. Trends: Key Identification
- Uptrend: Higher highs and higher lows
- Downtrend: Lower highs and lower lows
- Sideways range: No clear direction, bouncing between support/resistance
Golden rule: Trading in the direction of the main trend increases success probability.
📉 3. Key Technical Analysis Tools
A. Support and Resistance
- Support: Price level where demand exceeds supply (buyers emerge)
- Resistance: Price level where supply exceeds demand (sellers appear)
Real example with Apple (AAPL):
Key resistance at $197 (tested 3 times in 2023)
Strong support at $165 (held during pullbacks) 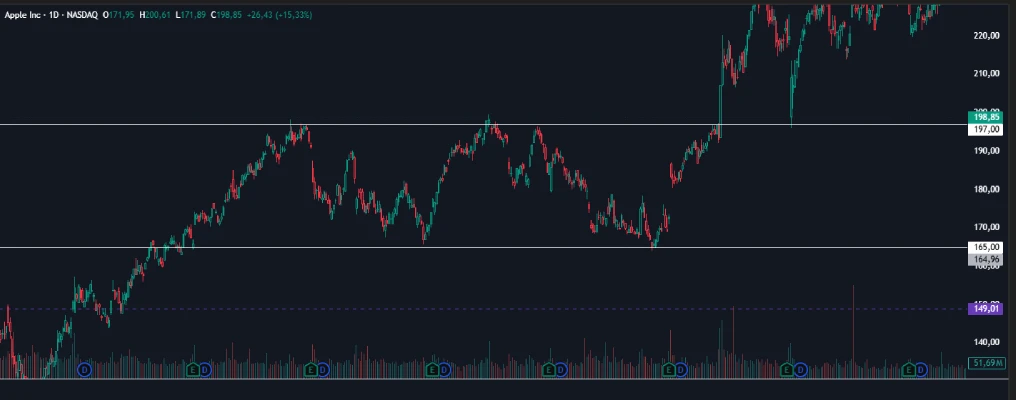
B. Moving Averages (Trend Indicators)
| Type | Calculation | Primary Use |
|---|---|---|
| SMA 50 | 50-day simple moving average | Medium-term trend |
| EMA 200 | 200-day exponential moving average | Long-term trend |
Crossover strategy: When SMA 50 crosses above EMA 200 (“Golden Cross”), bullish signal. The opposite (“Death Cross”) is bearish.
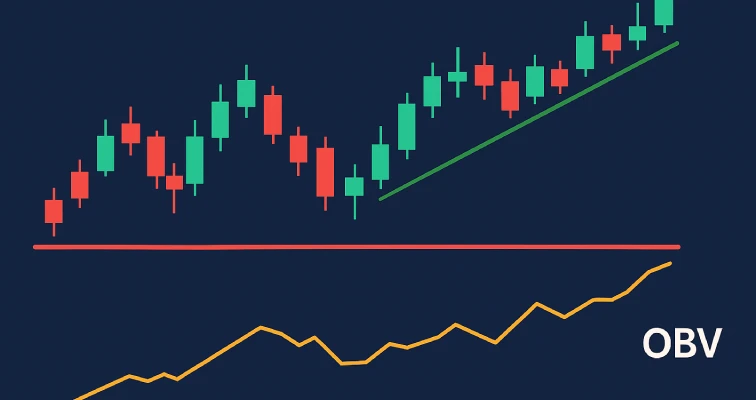
C. Momentum Indicators
- Range: 0-100
- >70 = Overbought (potential pullback)
- <30 = Oversold (potential bounce)
- Line crossovers: Buy/sell signals
- Divergences: Potential trend changes
🎯 4. Top Candlestick Patterns for Reversals and Continuations
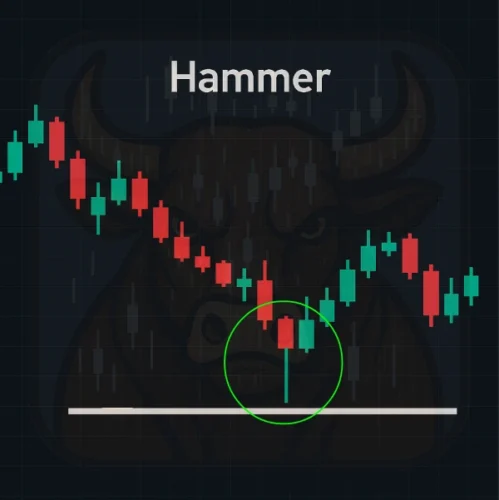
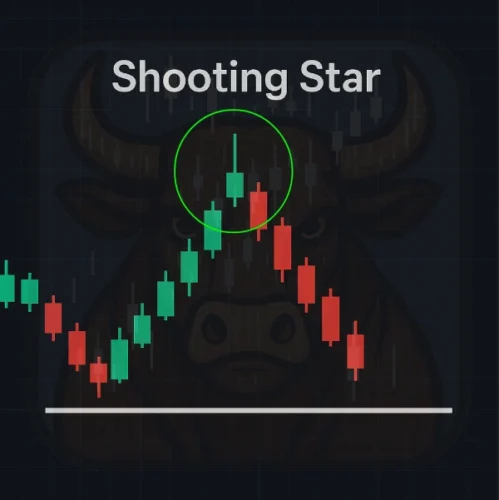
Reversal Patterns
- Hammer: Long lower wick in downtrend
- Shooting star: Long upper wick in uptrend
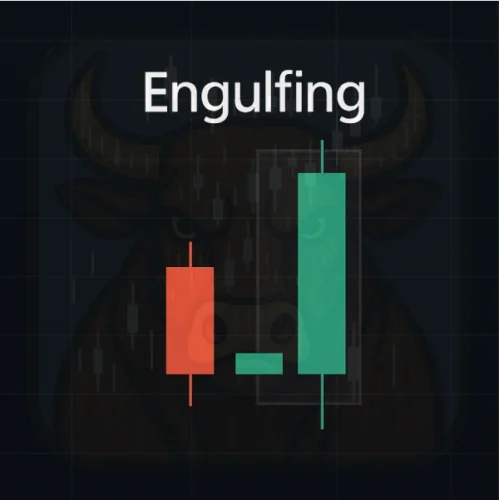
- Engulfing: Candle that “swallows” the previous one
Continuation Patterns
- Flags/Pennants: Small consolidation after strong move
- Triangles: Symmetrical, ascending, or descending
💻 5. Breakout Trading, Fibonacci & Elliott Waves Explained
A. Breakout Trading
- Identify sideways range
- Wait for high-volume breakout
- Enter with stop loss below broken level
B. Fibonacci Retracements
- Key levels: 38.2%, 50%, 61.8%
- Usage: Identify potential bounce zones during pullbacks
C. Elliott Waves (For experienced traders)
- 5 waves in trend direction
- 3 corrective waves
- Requires practice for accurate identification
⚠️ 6. Risks of Technical Analysis: False Breakouts & Overanalysis
- Self-fulfillment: Many traders watch the same levels
- False breakouts: Up to 40% of breakouts fail
- Overanalysis: Too many indicators create conflicting signals
Pro tip: Combine 2-3 indicators measuring different aspects (e.g., trend + momentum + volume).
📚 7. Practice Resources
- Platforms: TradingView (free for basic use), ThinkorSwim
- Demo accounts: Risk-free practice with virtual money
- Recommended Reading
- Guide to Volume Price Analysis by Anna Coulling
Technical Analysis of the Financial Markets by John J. Murphy
Next suggested steps:
- Practice pattern recognition on historical charts
- Backtest strategies with past data
- Begin with paper trading before using real capital
🎓Frequently Asked Questions (FAQ)
Is technical analysis useful for beginners?
Yes, especially for short-term trading. With practice, beginners can learn to recognize patterns, use indicators, and spot trends.
What is the best chart for day trading?
Candlestick charts are popular among day traders because they reveal market psychology and short-term price action clearly.
What are the most reliable technical indicators?
Commonly used indicators include RSI, MACD, and moving averages. It’s best to combine a few indicators for balanced analysis.
This introductory guide scratches the surface of technical analysis—many more advanced concepts (Fibonacci, Ichimoku, Triangles, etc.) await in future posts. But first, master these fundamentals by…”
(Next: Short Class 4 part 3 – Sentiment Analysis in Trading: How Market Mood Moves Prices)