🕯️ Candlestick Patterns Explained: What They Are and How to Trade Them (Visual Guide)
If Candlestick patterns are visual tools used in technical analysis to display price action over a given time period. They show the open, high, low, and close prices of a security, helping traders identify potential reversals, continuations, and momentum shifts.
Think of candlestick patterns as the body language of financial markets—each one reveals the hidden battle between buyers and sellers. Whether you’re trading stocks, crypto, or forex, learning how to read candles is one of the most important skills you can develop.
In this guide, you’ll discover:
✅ The fascinating history of candlestick charts
✅ How to read any candlestick in seconds
✅ 12 most powerful candlestick patterns
✅ How to trade patterns with accuracy
✅ Common beginner mistakes and how to avoid them
By the end, you’ll be able to spot trading opportunities just by reading the candles on your chart.
📜 A Brief History: From Rice Traders to Wall Street
Candlestick charts were born in 18th-century Japan, created by legendary rice trader Munehisa Homma. He used them to track price action and trader psychology—centuries before modern markets existed.
They reached the Western world in the 1990s thanks to Steve Nison, who introduced candlestick patterns to Wall Street in his book Japanese Candlestick Charting Techniques.
Today, candlesticks are one of the most widely used tools in technical analysis—trusted by stock, forex, and crypto traders worldwide.
📌 Fun fact: Some original Japanese names like “Doji” (meaning “at the same time”) are still used today!
🕯️ Candlestick Anatomy 101
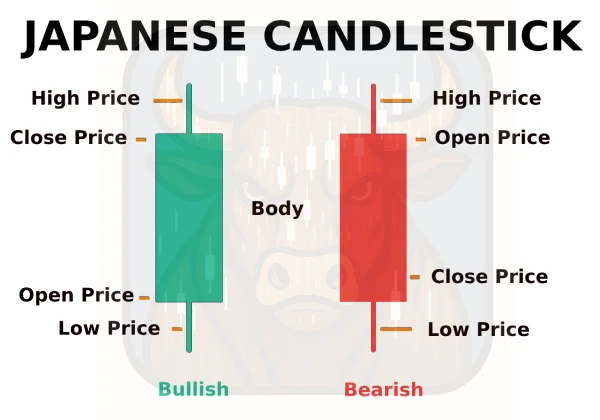
Every candlestick tells a story through four key pieces of information:
The Components:
| Part | What It Shows |
|---|---|
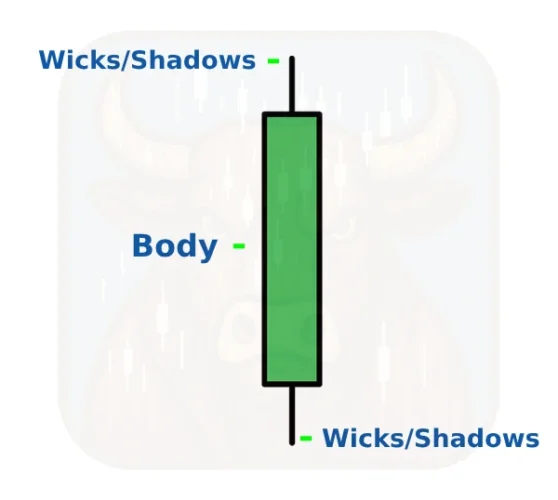
| Body | Opening & closing prices |
| Wicks/Shadows | High & low of the period |
| Color | Bullish (green/white) vs Bearish (red/black) |
📊 Example:
- If a stock opens at $50, drops to $48, rallies to $53, then closes at $52:
- Body = $50 to $52 (green)
- Lower wick = $48
- Upper wick = $53
💡 Pro Tip: The longer the body, the stronger the buying/selling pressure.
🔍 The 12 Most Powerful Candlestick Patterns for Traders
Candlestick patterns can signal key market turning points or the continuation of a trend. Mastering these high-probability formations can greatly improve your timing and trade accuracy.
We’ve broken them down into reversal and continuation patterns to help you identify setups in any market condition.
🛑 Top 8 Reversal Candlestick Patterns
These patterns suggest a potential trend reversal and are most powerful when they form near support or resistance levels, or after a strong trend.
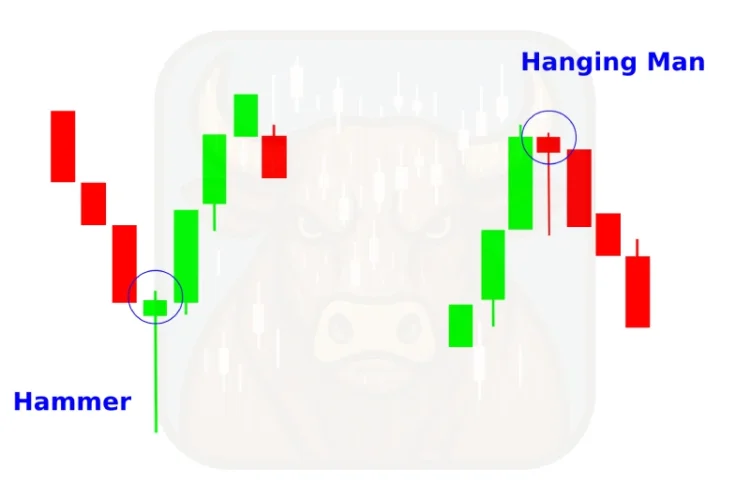
1. Hammer & Hanging Man
- Shape: Small real body, long lower shadow, little or no upper shadow
- Hammer: Appears at the bottom of a downtrend → Bullish reversal
- Hanging Man: Appears at the top of an uptrend → Bearish reversal
- Tip: Wait for confirmation candle after appearance
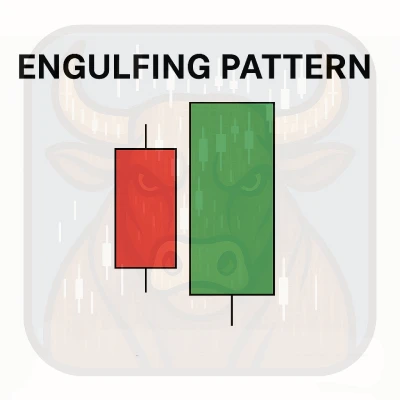
2. Engulfing Pattern (Bullish & Bearish)
- Bullish Engulfing: Green candle completely covers the previous red candle → Trend may reverse upward
- Bearish Engulfing: Red candle completely covers the previous green candle → Trend may reverse downward
- Best Use: Spot near market tops/bottoms with volume confirmation
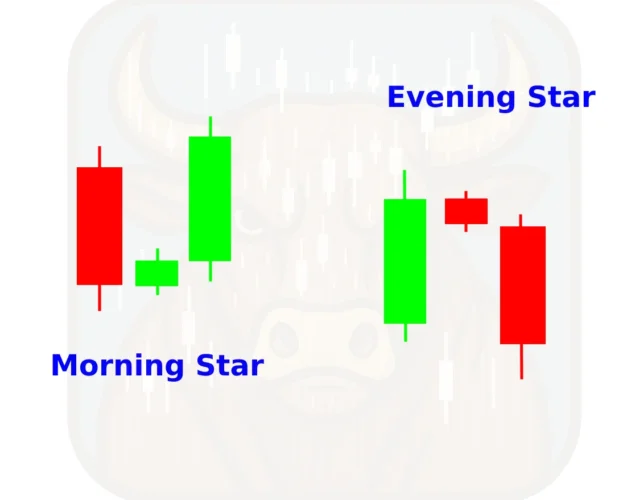
3. Morning Star & Evening Star
- 3-candle formation that signals strong reversals
- Morning Star: [Large red, small-bodied candle, large green] → Bullish
- Evening Star: [Large green, small-bodied candle, large red] → Bearish
- Great for: Swing and position traders on daily/weekly charts
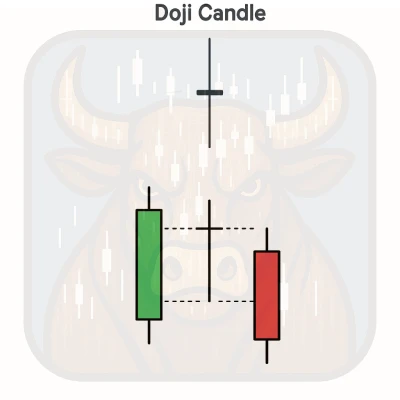
4. Doji Candlestick
- Open ≈ Close → Looks like a cross or plus sign
- Indicates indecision or possible reversal
- Types: Standard Doji, Long-legged Doji, Dragonfly, Gravestone
- Pro Tip: Best used when combined with support/resistance or RSI divergence
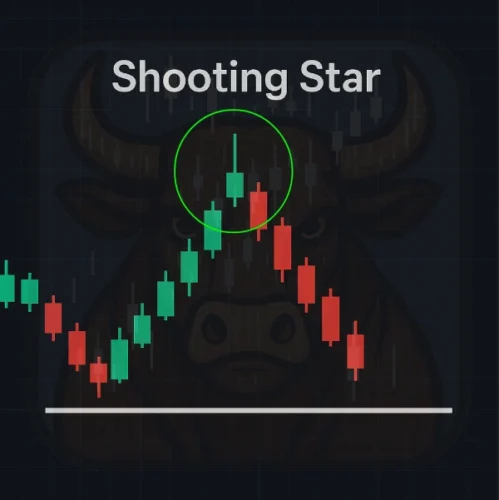
5. Shooting Star & Inverted Hammer
- Shooting Star: Appears at the end of an uptrend → Bearish
- Inverted Hammer: Appears at the end of a downtrend → Bullish
- Shape: Small body with long upper wick
- Often signals trend exhaustion or rejection of higher prices
“Well, you can probably imagine what the Inverted Hammer looks like if you know the regular one (Sorry, I was too lazy to make the image).”
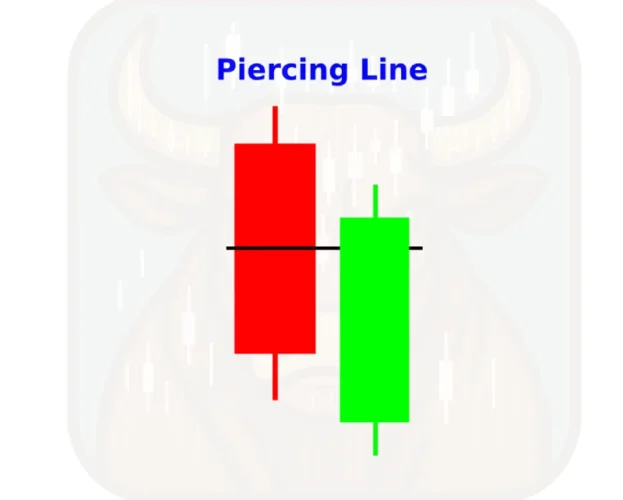
6. Piercing Line
- Bullish 2-candle reversal pattern
- First candle: long red
- Second candle: opens lower, closes at least halfway into the previous body
- Powerful near support zones during pullbacks
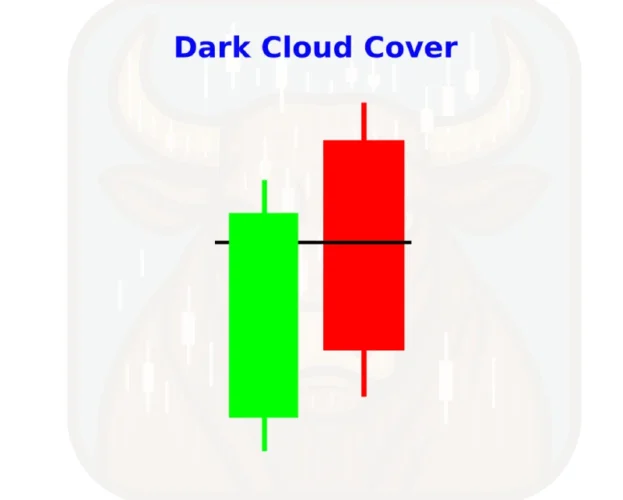
7. Dark Cloud Cover
- Bearish twin of Piercing Line
- First candle: long green
- Second candle: opens higher but closes deep into previous candle
- Suggests buying momentum is fading
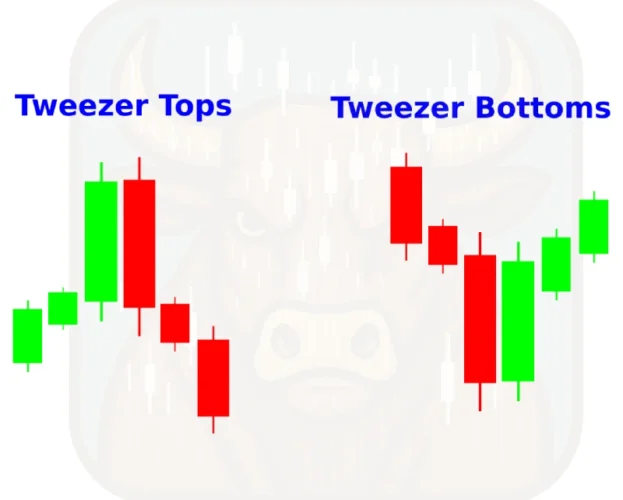
8. Tweezer Tops & Bottoms
- Two candles with similar highs (top) or lows (bottom)
- Signals strong rejection of a price level
- Useful for: Scalping and day trading reversals
➡️ Top 4 Continuation Candlestick Patterns
These patterns suggest that the existing trend is likely to continue after a brief pause or consolidation.
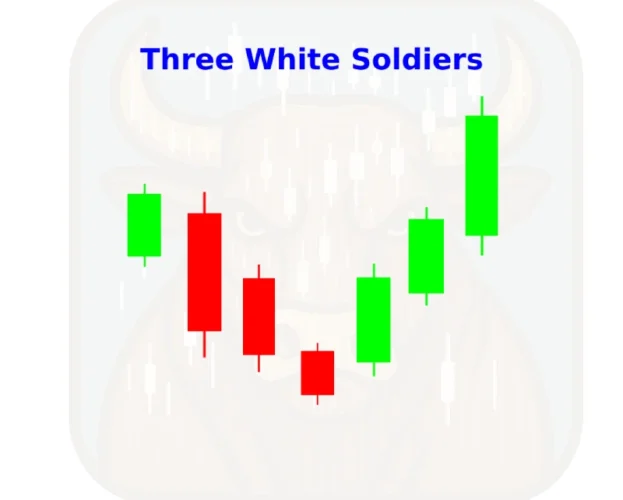
1. Three White Soldiers
- Three strong green candles in a row, each closing higher
- Appears after a downtrend or consolidation
- Confirms bullish strength and momentum
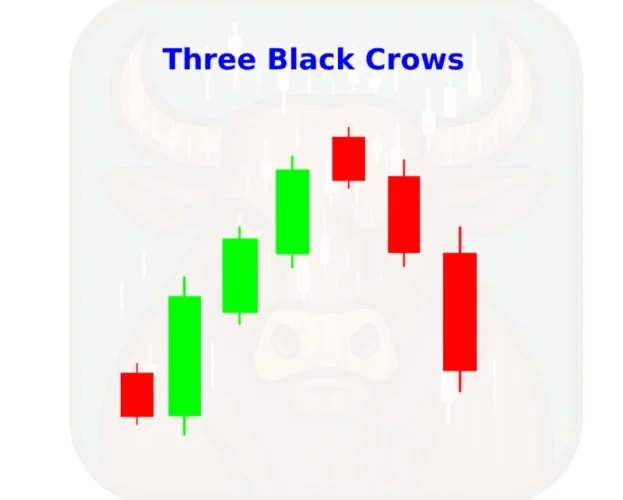
2. Three Black Crows
- Three strong red candles in a row, each closing lower
- Appears after an uptrend
- Indicates bearish control and trend continuation
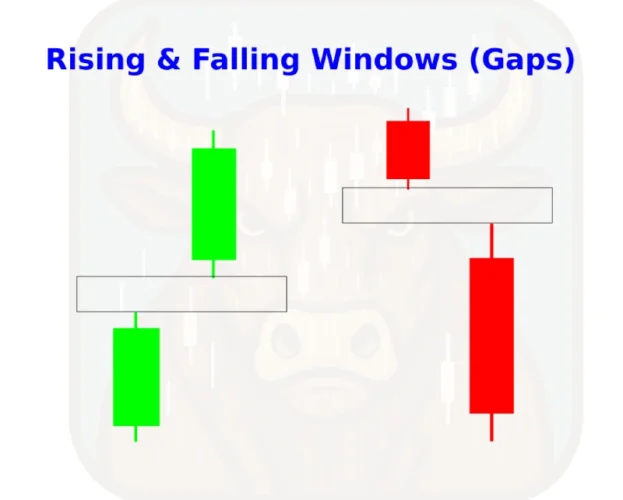
3. Rising & Falling Windows (Gaps)
- Rising Window (Bullish Gap): Price gaps up with no overlap
- Falling Window (Bearish Gap): Price gaps down with no overlap
- Indicates strong momentum in the direction of the gap
- Pro Tip: Use volume confirmation to validate the move
4. Bullish & Bearish Flag Patterns (Multi-candle)
- Short-term consolidation that slants against the trend, followed by breakout
- Bullish Flag: Down-sloping channel after a rally
- Bearish Flag: Up-sloping channel after a drop
- Ideal for trend-following strategies
Read More: Flags & Pennants: How to Trade Continuation Patterns Like a Pro
🔑 Pro Tips for All Patterns
- Always trade with the trend or at key reversal points
- Combine patterns with support/resistance, Fibonacci levels, or RSI
- Use volume as a secondary confirmation signal
- Look for confluence—when multiple patterns/indicators align
📈 How to Trade Candlestick Patterns Like a Pro
Step 1: Confirm the Trend First
- Never trade a hammer in a strong downtrend without confirmation
Step 2: Wait for Complete Patterns
- Don’t anticipate – let the candle close
Step 3: Add Volume Confirmation
- Higher volume = stronger signal
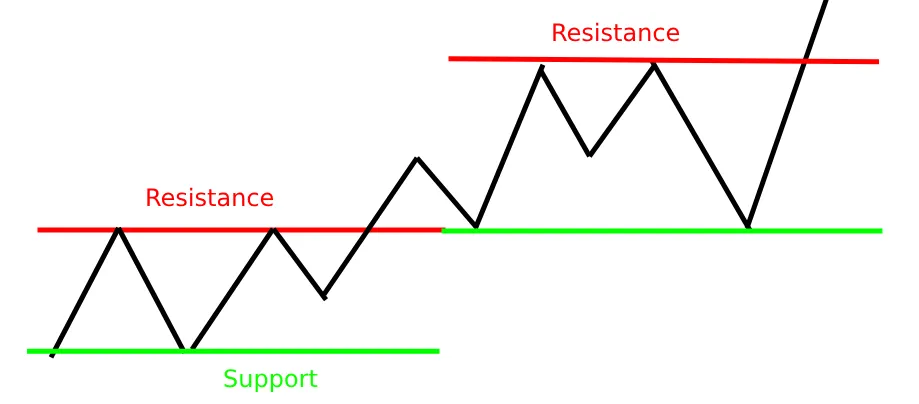
Step 4: Use Support/Resistance Levels
- Patterns near key levels are more reliable
Step 5: Set Proper Risk Management
- Stop-loss below pattern low (for longs)
⏳ Best Timeframes for Candlestick Patterns
| Trading Style | Ideal Timeframe | Notes |
|---|---|---|
| Scalping | 1-5 minute | Focus on simple patterns |
| Day Trading | 15-60 minute | Most balanced |
| Swing Trading | 4H-Daily | Highest reliability |
| Investing | Weekly-Monthly | For major trend changes |
💡 Golden Rule: The higher the timeframe, the more significant the pattern.
⚠️ 7 Deadly Candlestick Mistakes
❌ Trading patterns in isolation
❌ Ignoring the broader market context
❌ Chasing small timeframes (under 5min)
❌ Overlooking candle size and volume
❌ Forgetting about economic news events
❌ Taking every pattern as absolute truth
❌ Not using stop-losses
🔥 Advanced Candlestick Techniques: Boost Your Accuracy Like a Pro
Once you’ve mastered basic candlestick patterns, it’s time to level up. These advanced techniques will help you increase your win rate, filter out false signals, and make smarter entries by adding confluence to your analysis.
Here are four powerful ways to enhance your candlestick trading strategy:
1️⃣ Confluence with Multiple Patterns
What it means: When two or more bullish or bearish candlestick patterns appear at the same price level, it strengthens the reversal or continuation signal.
📌 Example: A bullish engulfing followed by a morning star at support = high-confidence buy setup.
✅ Why it works: More signals at the same level = stronger market consensus.
2️⃣ Combine Candlesticks with Fibonacci Levels
What it means: Use Fibonacci retracement levels (e.g., 38.2%, 50%, 61.8%) to validate candlestick reversals.
📌 Example: A hammer candle forming at the 61.8% retracement level during a pullback in an uptrend is a high-probability buy signal.
💡 Pro tip: Focus on patterns forming between the 50% and 61.8% levels—they often indicate exhaustion of corrections.
3️⃣ Volume Confirmation
What it means: Use volume spikes to validate the strength of a candlestick pattern.
📌 Example: A bullish engulfing with above-average volume suggests strong buyer momentum—not just a temporary bounce.
🚨 Warning: Low-volume candles are less reliable, especially in choppy or low-liquidity markets.
4️⃣ Timing with Market Open/Close (Session Context)
What it means: Certain candlestick patterns are more reliable at key times—like market open, close, or during major news events.
📌 Example: A shooting star forming near the close of a session after a strong rally often signals profit-taking and a potential reversal.
🕒 Best times to watch for reliable patterns:
- First hour of the trading day
- Last 30 minutes before market close
- After major economic news releases
🧠 Why Use These Techniques?
Combining candlestick patterns with volume, Fibonacci levels, key market times, and confluence signals can dramatically improve your accuracy. Rather than trading every pattern you see, these filters help you focus only on high-probability setups.
❓ Candlestick Pattern FAQs
The Engulfing pattern and the Morning Star are among the most reliable candlestick patterns, especially when confirmed by volume and key support/resistance zones.
When used with confirmation signals (like volume or trendlines), candlestick patterns can be 60–75% accurate depending on the pattern and market conditions.
Yes, candlestick patterns work across all markets—including crypto. However, due to higher volatility, it’s best to use them on longer timeframes like 1H, 4H, or daily charts in crypto.
Not at all. Focus on 5 to 10 high-probability patterns, like Engulfing, Hammer, Doji, and Morning Star. Mastering those gives you the edge you need.
No—while powerful, candlestick patterns work best when combined with technical indicators like RSI, MACD, volume, and support/resistance zones.
📌 Key Takeaways
✔ Candlesticks reveal market psychology through price action
✔ Reversal patterns signal trend changes
✔ Continuation patterns suggest trend resumption
✔ Always confirm with volume and key levels
✔ Higher timeframes = more reliable signals
🎯 Final Thoughts & Next Steps
Candlestick patterns are like learning to read the market’s emotions. While not perfect alone, when combined with other tools, they become an incredibly powerful part of your trading arsenal.
💡 Your Action Plan:
- Pick 3 patterns to study deeply
- Practice identifying them on historical charts
- Start paper trading with these patterns
- Gradually add more patterns to your toolkit
Recommended Reading
Guide to Volume Price Analysis by Anna Coulling
Technical Analysis of the Financial Markets by John J. Murphy