📊 Chart Patterns in Trading: A Complete Guide for Beginners
🔍 What Are Chart Patterns?
Chart patterns (or graphical patterns) are visual formations that appear on price charts, helping traders predict future market movements based on historical behavior. These patterns emerge from market psychology—reflecting the battle between fear, greed, and indecision among buyers and sellers.
Technical analysts use these patterns to identify trend reversals, breakouts, and continuations, making them essential for scalping, day trading, swing trading, and long-term investing.
“Next, I’ll teach you the basics of the most common patterns so you can start getting familiar with them. Of course, this will just be an introduction to keep the post from getting too long—I’ll dive deeper into each one in individual posts later. 🚀”
📈 Most Common Chart Patterns in Trading (Explained with Examples)
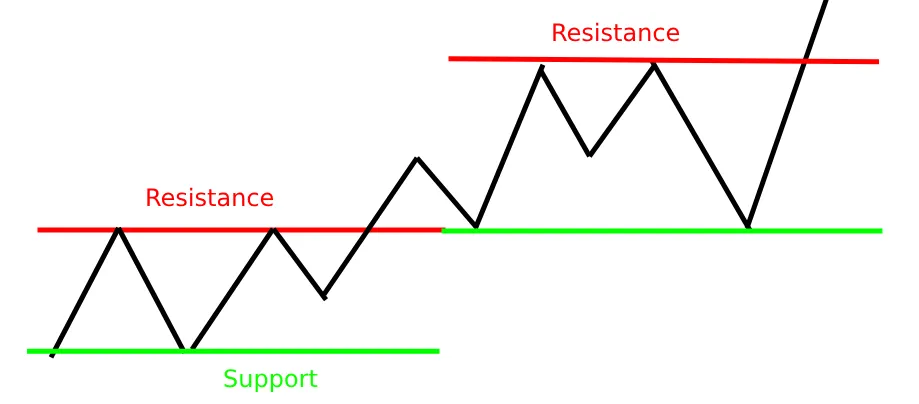
1️⃣ Support and Resistance – The Market’s Floor and Ceiling
- Support: A price level where buying pressure prevents further decline (like a floor).
- Resistance: A price level where selling pressure halts upward movement (like a ceiling).
- Breakout Strategy: When price breaks resistance, it often rises further (bullish). When it breaks support, it often falls further (bearish).
📌 Example
📚 Recommended Read: Support and Resistance – The Market’s Floor and Ceiling
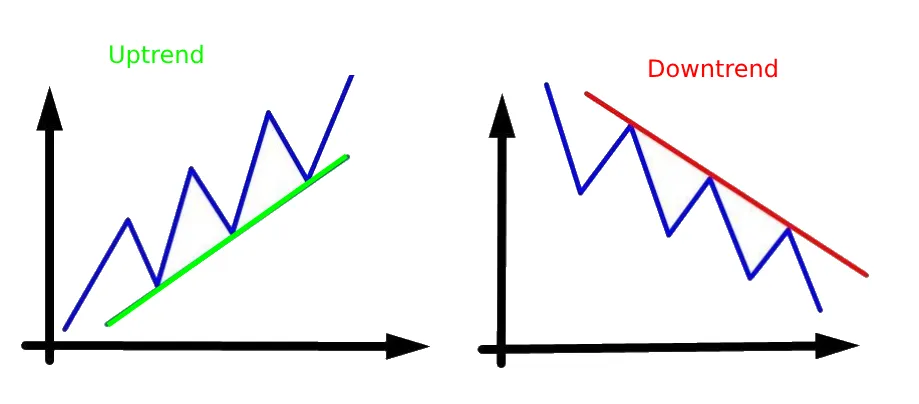
2️⃣ Trend Lines – Identifying Market Direction
- Uptrend: Higher highs & higher lows (bullish).
- Downtrend: Lower highs & lower lows (bearish).
- Sideways Trend: No clear direction (consolidation).
📌 Example
📚 Recommended Read: Trend Lines – How to Identify Market Direction Like a Pro
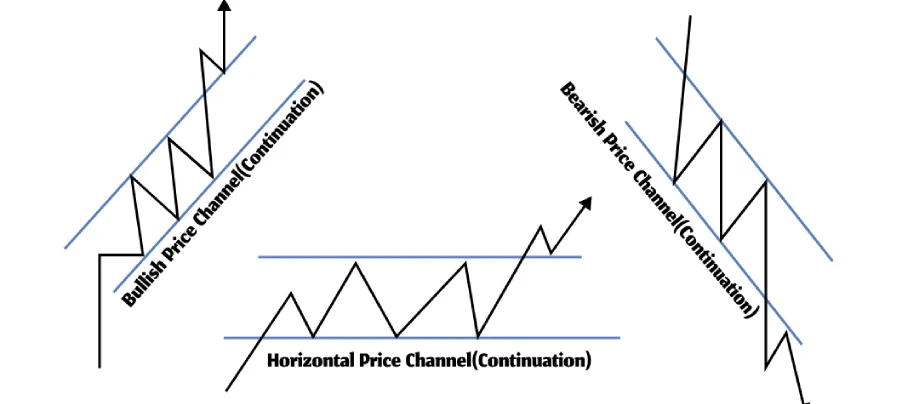
3️⃣ Channels – Trading Within Boundaries
- Ascending Channel: Higher highs & higher lows (buy at support).
- Descending Channel: Lower highs & lower lows (sell at resistance).
📌 Example
📚 Recommended Read: What is a Trading Channel? Bullish, Bearish & Horizontal Explained
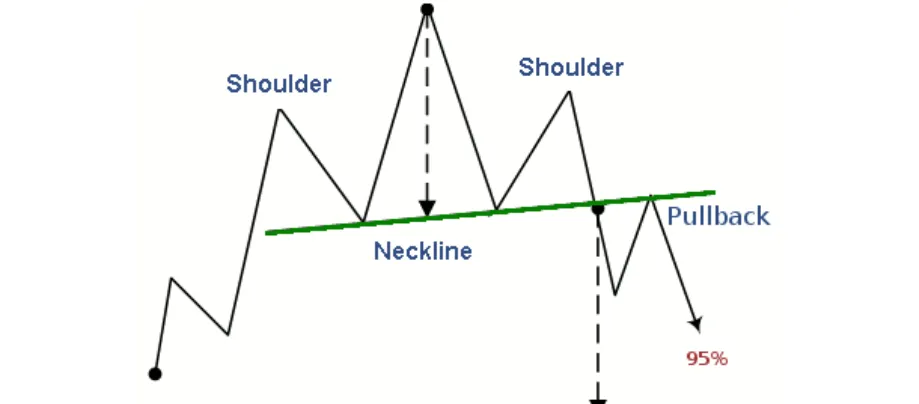
4️⃣ Head and Shoulders (H&S) – Classic Reversal Pattern
- Structure: Left shoulder → Higher peak (head) → Right shoulder → Neckline break.
- Bearish Signal: Break below neckline = sell signal.
📌 Example
📚 Recommended Read: What is a Head and Shoulders Pattern and Inverse? The Ultimate Reversal Signal
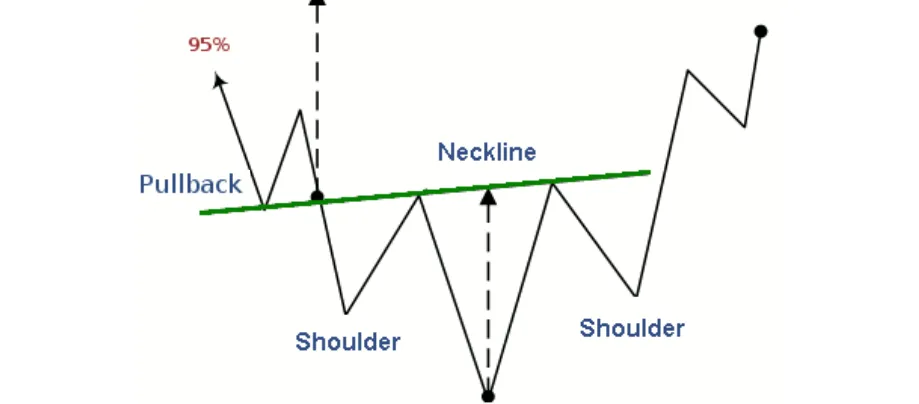
5️⃣ Inverse Head and Shoulders – Bullish Reversal
- Structure: Left shoulder → Lower dip (head) → Right shoulder → Neckline break.
- Bullish Signal: Break above neckline = buy signal.
📌 Example
📚 Recommended Read: What is a Head and Shoulders Pattern and Inverse? The Ultimate Reversal Signal
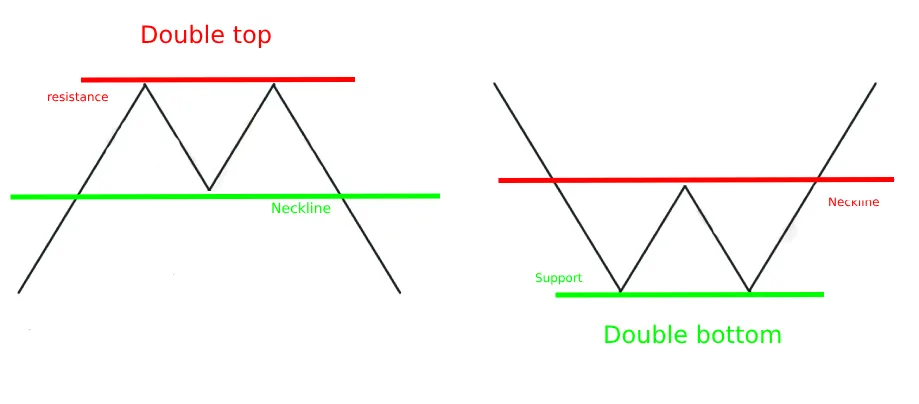
6️⃣ Double Top & Double Bottom – Reversal Signals
- Double Top (M-shape): Two peaks at resistance → bearish reversal.
- Double Bottom (W-shape): Two bounces at support → bullish reversal.
📌 Example
📚 Recommended Read: Double Top & Double Bottom Patterns: The Complete Reversal TradingGuide
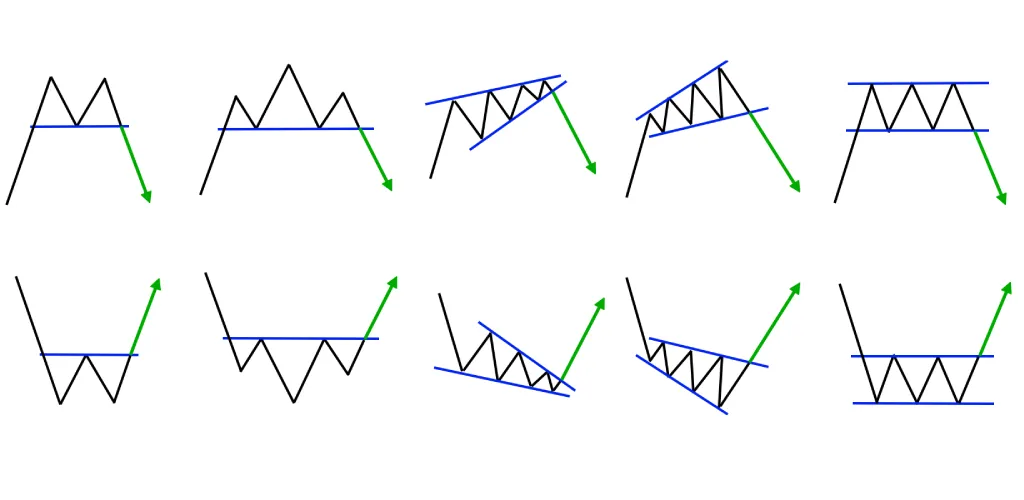
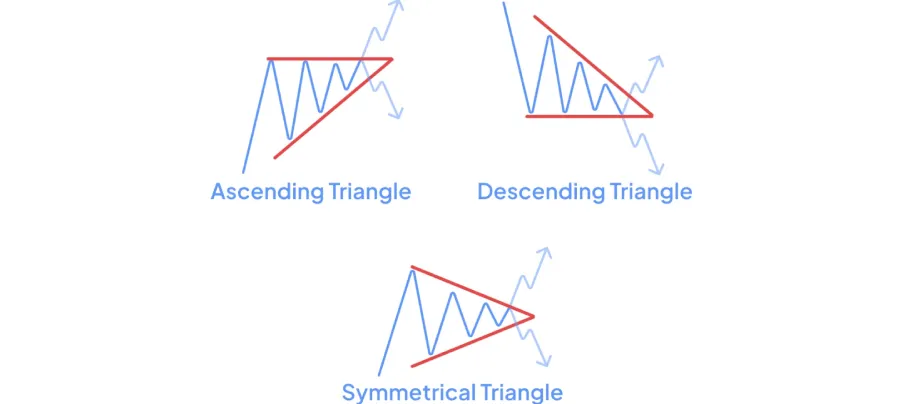
7️⃣ Triangles – Compression Before Breakout
- Ascending Triangle: Flat resistance + rising support → bullish breakout likely.
- Descending Triangle: Flat support + falling resistance → bearish breakout likely.
- Symmetrical Triangle: Converging trendlines → breakout direction unclear.
📌 Example
📚 Recommended Read: What Are Triangle Patterns? The 3 Key Variants Traders Must Know
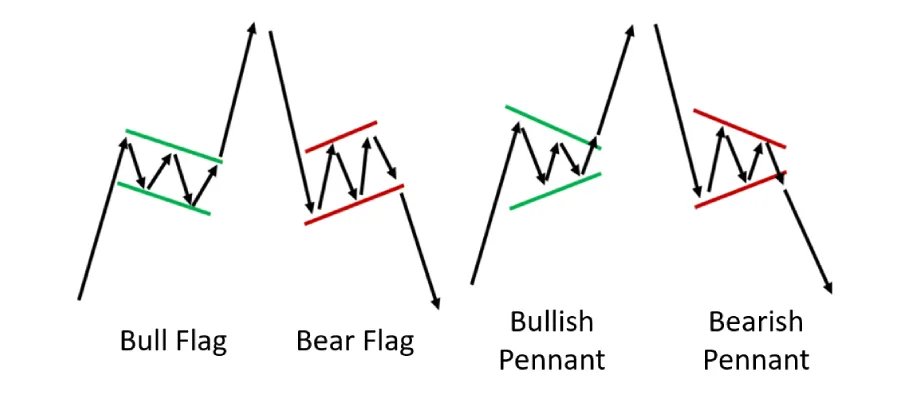
8️⃣ Flags & Pennants – Continuation Patterns
- Flag: Small consolidation after a strong move (resembles a flag on a pole).
- Pennant: Small symmetrical triangle after a strong move.
- Expectation: Trend resumes after breakout.
📌 Example
📚 Recommended Read: Flags & Pennants: How to Trade Continuation Patterns Like a Pro
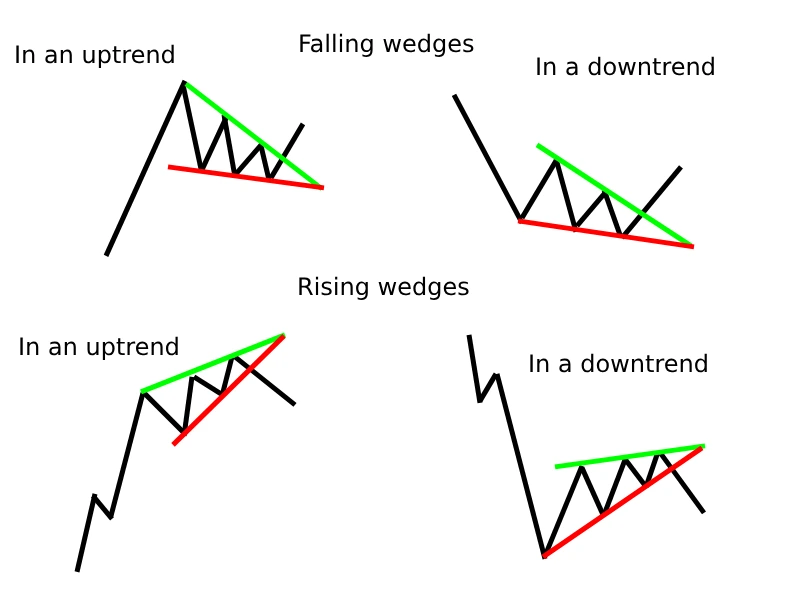
9️⃣ Wedges – Reversal or Continuation?
- Rising Wedge: Higher highs & higher lows (but usually bearish reversal).
- Falling Wedge: Lower highs & lower lows (but usually bullish reversal).
📌 Example
📚 Recommended Read: Wedges in Trading: Reversal or Continuation Patterns Explained
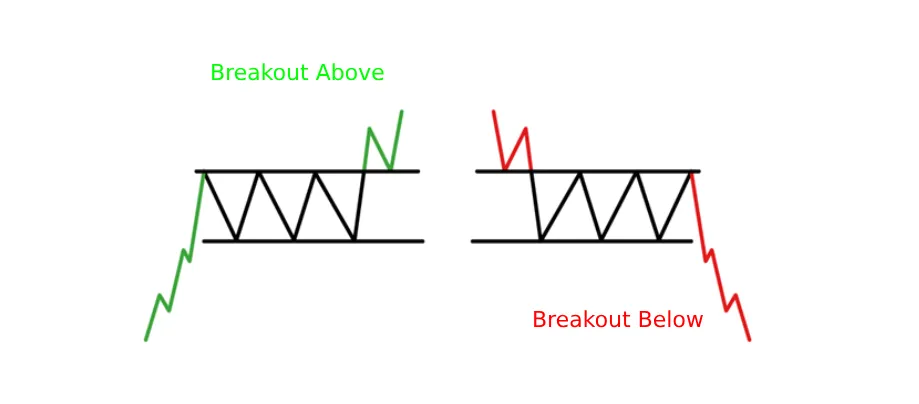
🔟 Rectangles – Accumulation or Distribution?
- Breakout Above: Bullish (accumulation).
- Breakout Below: Bearish (distribution).
📌 Example
📚 Recommended Read: Rectangles in Trading: Accumulation or Distribution Patterns Explained
📊 How to Trade Chart Patterns (Pro Strategies)
✅ Confirm with Volume: Breakouts with high trading volume are more reliable.
✅ Measure Price Targets:
- For H&S, measure the head’s height and project it from the neckline.
- For triangles, measure the base width and project it from the breakout point.
✅ Use Indicators: Combine with RSI, MACD, or moving averages for confirmation.
⚠️ Common Mistakes & Risks
❌ False Breakouts: Price breaks out but reverses (use stop-loss orders).
❌ Overfitting Patterns: Not every movement is a pattern—avoid forcing it.
❌ Ignoring Market Context: News and fundamentals can override patterns.
🛠️ Best Tools for Chart Pattern Analysis
🔹 TradingView (best for pattern recognition).
🔹 MetaTrader 4/5 (popular among forex traders).
🔹 Books: Technical Analysis of the Financial Markets (John Murphy).
🚀 Final Thoughts
Chart patterns are powerful tools, but not foolproof. Always:
✔ Backtest strategies before trading real money.
✔ Use risk management (never risk more than 1-2% per trade).
✔ Stay updated—markets evolve!
Recommended Reading
Guide to Volume Price Analysis by Anna Coulling
Technical Analysis of the Financial Markets by John J. Murphy