📊 What is the Stochastic Oscillator? How to Spot Overbought & Oversold Levels Like a Pro
Did you know that the indicator that has saved so many trading accounts was actually developed in a bathroom? George Lane created the Stochastic Oscillator in the 1950s while observing how prices tend to “close” near extremes before reversing. This quirky fact hides a powerful truth – understanding Stochastics can help you spot turns before most traders see them coming.
In this guide, you’ll discover:
✅ The simple math behind Stochastics (no PhD needed)
✅ How to read overbought/oversold levels correctly
✅ 3 professional trading strategies using Stochastics
✅ Why most beginners use it wrong (and how to avoid this)
I used to think crossing 80 meant “sell” and 20 meant “buy,” until I lost a lot of money realizing it’s not that simple. Let me save you the trouble.
🔍 What is the Stochastic Oscillator?
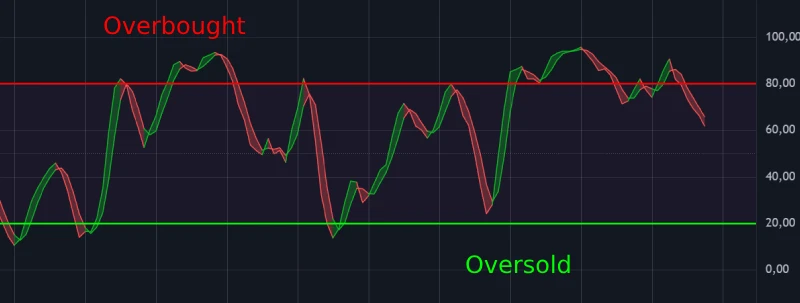
The Stochastic Oscillator is a momentum indicator that compares a security’s closing price to its price range over a set period. It ranges from 0 to 100 and helps identify:
- Overbought conditions (typically above 80)
- Oversold conditions (typically below 20)
- Potential trend reversals
📌 Key Components:
- %K Line (Green): Fast, more sensitive
- %D Line (Red): Slow, smoothed version of %K
Why Traders Love It:
✔ Works in all markets (stocks, forex, crypto)
✔ Effective on multiple timeframes
✔ Combines well with RSI and MACD
🧮 How Stochastic is Calculated
Here’s the formula without the math headache (Don’t worry, you’ll never have to calculate it yourself, but it’s always good to know how it’s done.)
%K = [(Current Close - Lowest Low) / (Highest High - Lowest Low)] × 100Where:
- Lowest Low = Lowest price in last X periods
- Highest High = Highest price in last X periods
Standard Settings:
- 14 periods (adjustable)
- 3-period smoothing for %D line
💡 Pro Tip: The default 14,3,3 settings work best for most traders – don’t overcomplicate it!
📈 How to Read the Stochastic Indicator Like a Pro Trader
Here’s the secret: it’s not just about spotting overbought and oversold levels — it’s about understanding context and timing.
Let’s break it down:
1️⃣ Overbought and Oversold Zones (But It’s Not That Simple)
| Stochastic Level | Condition | What It Actually Signals |
|---|---|---|
| Above 80 | Overbought | Price is strong, may pull back or keep running up |
| Below 20 | Oversold | Price is weak, might bounce or fall even more |
⚠️ Important: Just because the Stochastic shows overbought or oversold doesn’t mean you should blindly buy or sell.
In strong trends, overbought can stay overbought for weeks!
Example: During Tesla’s 2020 rally, Stochastic stayed above 80 for almost a month — short-sellers got crushed.
👉 Tip: When reading Stochastic levels, always check the overall trend first.
2️⃣ Stochastic Crossovers Are the Real Money Signals
- Bullish Signal: %K line (Green) crosses above %D line (red) near the oversold area → Possible buy setup.
- Bearish Signal: %K line crosses below %D line near the overbought area → Possible sell setup.
🔥 Pro Trick: Crossovers inside the extreme zones (above 80, below 20) are much stronger than random crossovers in the middle.
3️⃣ Stochastic Divergences Predict Big Market Reversals
- Regular Divergence:
Price makes a higher high, but Stochastic makes a lower high → Early warning of a possible drop. - Hidden Divergence:
Price makes a lower low, but Stochastic makes a higher low → Clue of a possible rally.
🎯 Divergences + crossovers together = Highest probability setups.
🚀 Quick Cheat Sheet: How Pros Read Stochastic
✔ Overbought/Oversold = Watch, don’t rush
✔ Crossovers = Potential entry points
✔ Divergences = Big trend change clues
✔ Always check the bigger trend first
💼 3 Simple Stochastic Trading Strategies
Here’s how traders use the Stochastic Oscillator in real life — without overcomplicating things.
1️⃣ The Trend-Following Bounce
Idea:
Trade with the trend after a pullback.
How to do it:
- Find a clear uptrend or downtrend (higher highs for uptrend, lower lows for downtrend).
- Wait for Stochastic to reach oversold (below 20) in an uptrend, or overbought (above 80) in a downtrend.
- Enter the trade when %K crosses %D in the direction of the trend.
Why it works:
You are buying dips or selling rallies inside a strong trend — not fighting it.
2️⃣ The Double-Cross Confirmation
Idea:
Wait for extra confirmation before entering.
How to do it:
- First, watch for a %K and %D crossover.
- Don’t enter yet — wait for a small pullback and then a second crossover in the same direction.
- Enter after the second signal.
Why it works:
It helps avoid jumping into weak moves or fakeouts.
3️⃣ The Divergence Hunter
Idea:
Spot when momentum is slowing down before the price changes direction.
How to do it:
- Look for divergence:
- Price makes a new high but Stochastic makes a lower high (bearish divergence).
- Price makes a new low but Stochastic makes a higher low (bullish divergence).
- After seeing divergence, wait for %K to cross %D and leave the overbought or oversold zone.
- Enter the trade once momentum starts shifting.
Why it works:
Divergence often happens before a big reversal.
✅ Tip: Stick to one strategy at first, master it before trying to combine them.
⏳ Best Timeframes & Markets
| Trading Style | Ideal Timeframe | Why? |
|---|---|---|
| Scalping | 5-15 min | Use 10,3,3 settings |
| Day Trading | 30 min-1H | Default 14,3,3 works |
| Swing Trading | 4H-Daily | Most reliable signals |
| Crypto Trading | 4H+ | Less whipsaws |
⚠️ Warning: On volatile cryptos, I use 21,7,7 settings to reduce noise.
⚠️ 5 Costly Stochastic Mistakes
❌ Trading every crossover (Wait for context)
❌ Ignoring the trend direction (Overbought in uptrend ≠ sell)
❌ Using alone (Pair with trendlines or moving averages)
❌ Changing settings constantly (Stick to one configuration)
❌ Forgetting about fundamentals (Earnings reports break technicals)
I learned this the hard way, shorting an “overbought” stock right before its earnings report.
🔄 Stochastic vs RSI: Which is Better?
| Feature | Stochastic | RSI |
|---|---|---|
| Best For | Reversals | Momentum |
| Overbought/Oversold | More sensitive | More stable |
| Divergences | Clearer | Less visible |
| Trending Markets | Needs adjustment | Works better |
💡 Smart Move: Use both – when they agree, signals are strongest.
❓ Stochastic FAQs From Real Traders
Start with 14,3,3. For day trading, try 10,3,3. For less noise, 21,7,7.
Some platforms use “Fast” vs “Slow” Stochastic variants. Stick to “Slow Stochastic.”
No indicator can. It shows probabilities – always use stop losses.
Yes, but combine with implied volatility indicators.
Developed in the 1950s – still used because price behavior hasn’t changed.
📌 Key Takeaways
✔ Stochastic measures price momentum relative to recent range
✔ Overbought (>80)/oversold (<20) are clues, not commands
✔ Crossovers + divergences provide strongest signals
✔ Works best with trend confirmation
✔ Adjust settings based on market volatility
🚀 Your Next Steps
- Today: Add Stochastic to your charts with default settings
- This Week: Practice spotting divergences on historical data
- Next Month: Combine with one other indicator (I suggest EMA)
- Ongoing: Keep a log of your Stochastic trades
Recommended Reading
Guide to Volume Price Analysis by Anna Coulling
Technical Analysis of the Financial Markets by John J. Murphy