What is RSI in Trading? A Beginner’s Guide to the Relative Strength Index
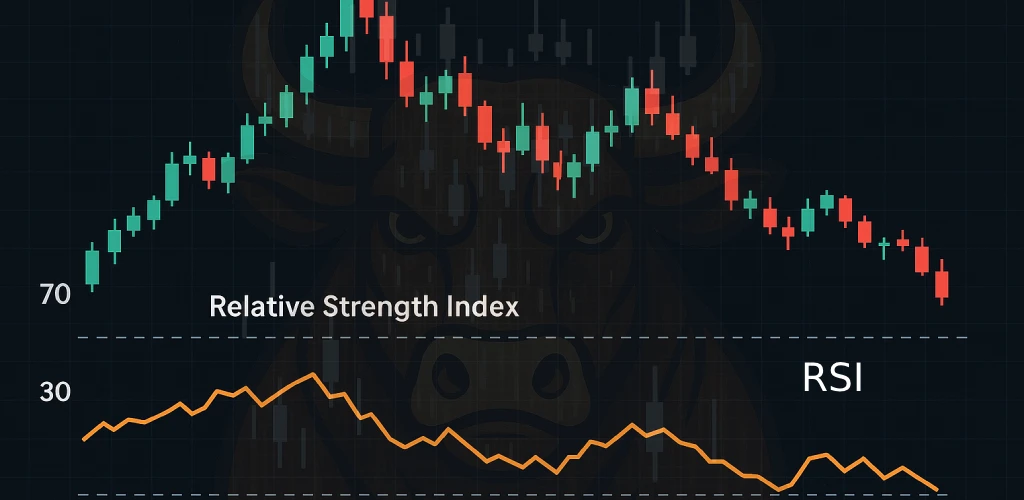
📈 What is RSI in Trading? A Beginner’s Guide to the Relative Strength Index If you’re exploring technical analysis and want to understand how traders spot momentum shifts and potential reversals, the Relative Strength Index (RSI) is one of the…