📈 The Three Main Types of Market Analysis: Complete Guide for Traders and Investors
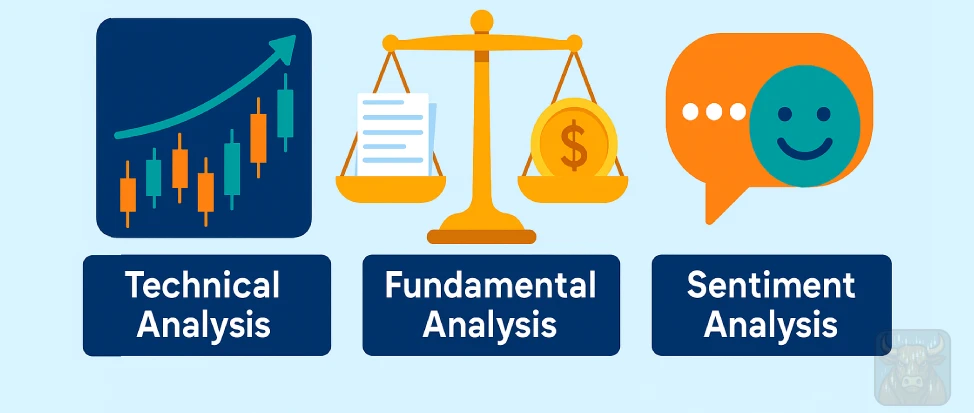
There are three main types of market analysis in trading and investing: fundamental, technical, and sentiment analysis. Each plays a unique role in helping traders and investors make smarter decisions. Whether you’re investing for the long term or trading actively, understanding the three primary types of market analysis is crucial. Each method offers unique insights, and combining them can significantly improve your strategy.
This guide will explain:
✅ Fundamental Analysis (for long-term investors)
✅ Technical Analysis (for traders)
✅ Sentiment Analysis (to gauge market psychology)
Plus, we’ll cover:
🔹 How to combine all three for better results
🔹 Real-world examples of each analysis type in action
🔹 Free tools and resources to get started
📊 1. Fundamental Analysis: Evaluating an Asset’s True Value
What Is Fundamental Analysis?
Fundamental analysis (FA) examines a company’s financial health, industry position, and economic conditions to determine whether an asset (like a stock or cryptocurrency) is undervalued or overvalued.
🔹 Key Tools & Metrics Used in Fundamental Analysis
| Category | What’s Analyzed | Example Metrics |
|---|---|---|
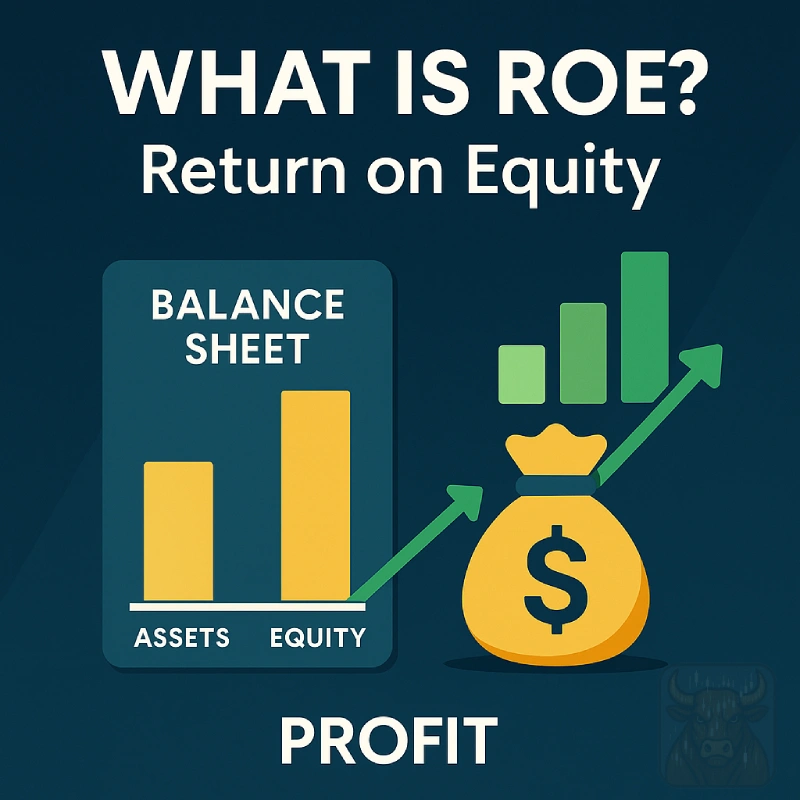
| Financials | Revenue, profits, debt, cash flow | P/E Ratio, ROE, Debt-to-Equity |
| Economic Factors | Interest rates, inflation, GDP | Federal Reserve policies, CPI data |
| Industry Trends | Market competition, growth potential | Market share, competitive advantages |
📌 Example: Analyzing a Stock with FA
If a company has:
✔ Low P/E ratio (cheap relative to earnings)
✔ Strong revenue growth (increasing sales)
✔ Low debt levels (less financial risk)
→ It might be a good long-term investment.
⭐ Best For:
- Those who prefer stable, well-researched investments
- Value investors (like Warren Buffett)
- Long-term stock & crypto holders
📚 Recommended Read: Short Class 4 Part 1 – Fundamental Analysis: The Core of Smart Investing
📉 2. Technical Analysis: Predicting Price Movements with Charts
What Is Technical Analysis?
Technical analysis (TA) studies price charts and trading volume to forecast future movements. Unlike FA, TA ignores company fundamentals and focuses purely on market behavior.
🔹 Essential Technical Analysis Tools
| Tool | Purpose | Example Use |
|---|---|---|
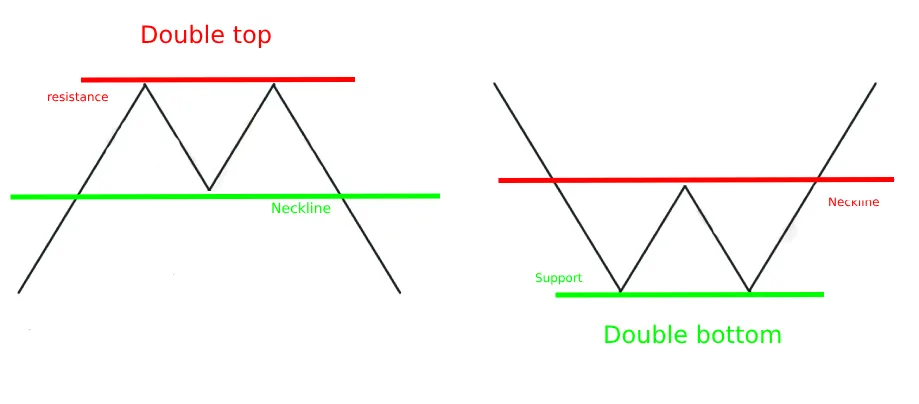
| Candlestick Patterns | Identify trends & reversals | Doji = potential trend change |
| Moving Averages | Smooth out price trends | 50-day vs. 200-day MA crossover |
| RSI (Relative Strength Index) | Spot overbought/oversold conditions | RSI > 70 = overbought (sell signal) |
| Support & Resistance | Key price levels for entry/exit | Bounce at support = buying opportunity |
📌 Example: Bitcoin Technical Analysis
- If BTC breaks above $100,000 resistance, traders may expect a rally.
- If RSI is above 70, it might be overbought (time to sell).
⭐ Best For:
- Day traders & swing traders
- Cryptocurrency & forex traders
- Short-term market timing
📈 Free Charting Tools: TradingView, CoinGecko, Yahoo Finance
⭐ Ideal for: Short-term traders (day trading, swing trading, scalping).
📚 Recommended Read: Short Class 4 Part 2 – Technical Analysis Basics!
📰 3. Sentiment Analysis: Measuring Market Emotions
What Is Sentiment Analysis?
Sentiment analysis tracks investor psychology—whether the market is driven by fear, greed, or indifference. Extreme sentiment often signals reversals.
🔹 Key Sentiment Indicators
| Indicator | What It Measures | Example |
|---|---|---|
| Fear & Greed Index | Overall market sentiment | Extreme fear = potential buying opp |
| Social Media Trends | Reddit, Twitter discussions | Meme stock hype (e.g., GameStop) |
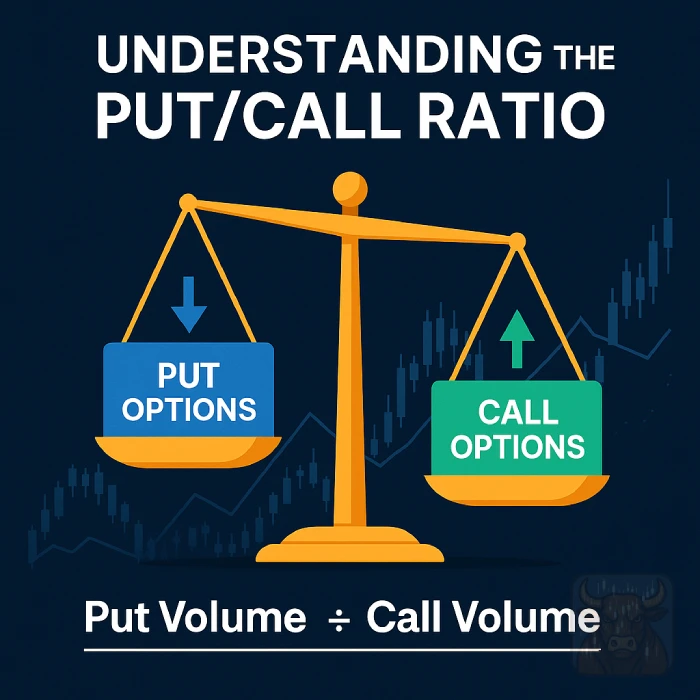
| Put/Call Ratio | Options market bias (bearish/bullish) | High put volume = fear |
📌 Example: Sentiment in the Stock Market
- When everyone is bullish, the market may be near a top.
- When panic selling occurs, it could be a buying opportunity.
⭐ Best For:
- Contrarian investors
- Spotting market extremes
- Combining with FA & TA for confirmation
📊 Free Sentiment Tools: CNN Fear & Greed Index, LunarCrush (for crypto)
⭐ Ideal for: Combining with technical or fundamental analysis.
📚 Recommended Read: Short Class 4 Part 3 – Sentiment Analysis in Trading: How Market Mood Moves Prices
🎯 Which Type of Analysis is Best? (Spoiler: Use All Three!)
| Analysis Type | Best For | Tools Used | Weakness |
|---|---|---|---|
| Fundamental | Long-term investing | Financial ratios, earnings | Slow to react |
| Technical | Short-term trading | Charts, RSI, moving averages | Ignores fundamentals |
| Sentiment | Market mood & reversals | Social trends, fear/greed index | Can be irrational/hyped |
How to Combine Fundamental, Technical & Sentiment Analysis
1️⃣ Fundamental Analysis → Pick strong assets (stocks, crypto) with long-term potential.
2️⃣ Technical Analysis → Time your entry & exit points.
3️⃣ Sentiment Analysis → Avoid buying at peaks of euphoria or selling in panic.
Real-World Example: Tesla (TSLA) Stock
- FA: Strong EV market growth, high revenue.
- TA: Breakout above $155 resistance in 2020.
- Sentiment: Extreme hype on social media → later correction.
🚀 Next Steps: How to Start Applying These Methods
✔ For Beginners: Start with one analysis type (e.g., technical for trading).
✔ For Advanced Traders: Combine 2 or 3 methods for higher accuracy.
✔ Free Resources:
- Fundamental Analysis: SEC Edgar, Yahoo Finance
- Technical Analysis: TradingView, Investopedia
- Sentiment Analysis: StockTwits, Fear & Greed Index