
📊 What Are Moving Averages? A Beginner’s Guide to SMAs, EMAs, and Trading Strategies
If you’ve ever looked at stock charts, weather trends, or even sales forecasts, you’ve probably encountered moving averages. But what exactly are they, and why are they so widely used?
In this guide, we’ll break down:
✅ What moving averages are
✅ Different types of moving averages
✅ How they’re calculated
✅ Practical uses in trading, business, and more
By the end, you’ll have a solid understanding of this essential analytical tool. Let’s dive in!
🔍 What Are Moving Averages? (Simple Definition)
A moving average (MA) is a statistical calculation used to analyze trends in data over time by creating a constantly updated average over a specific period. It helps smooth out short-term fluctuations and highlight long-term trends.
📌 Example: Let’s say you’re looking at the 10-day moving average of Apple stock. The indicator will show the average closing price of the last 10 trading days, recalculated each day.
🔍Why Use Moving Averages?
✔ Reduces noise – Filters out random price swings.
✔ Identifies trends – Shows if an asset is rising or falling.
✔ Supports decision-making – Traders & analysts use MAs to predict future movements.
📈 Types of Moving Averages
There are two main types of moving averages:
1️⃣ Simple Moving Average (SMA)
The SMA calculates the average of a dataset over a fixed number of periods.
🔹 Formula:
SMA = (Sum of Closing Prices over 'n' periods) / n
🔹 Example: A 5-day SMA adds the last 5 closing prices and divides by 5.
✅ Pros: Easy to calculate, smooths data well.
❌ Cons: Lags behind recent price changes.
2️⃣ Exponential Moving Average (EMA)
The EMA gives more weight to recent prices, making it more responsive to new data.
🔹 Formula:
EMA = (Current Price × Multiplier) + (Previous EMA × (1 − Multiplier))
(Where Multiplier = 2 / (n + 1), and n = period length)
Where n = number of periods (for example, 10, 20, 50, etc.)
✅ Pros: Reacts faster to price changes.
❌ Cons: More complex, can be overly sensitive.
I gotta say, I feel pretty blessed to be born in this modern era where this calculation is done automatically on any charting platform—just imagine having to do it manually every single time!
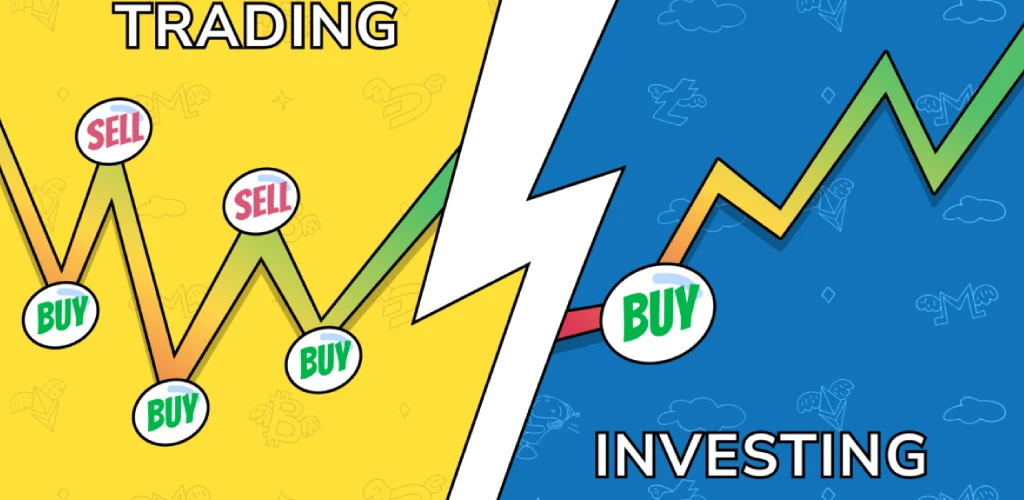
📊 Moving Averages in Trading (Most Common Use Case)
Traders use moving averages to:
- Spot trend reversals (e.g., when price crosses above/below MA).
- Identify support/resistance levels (price often bounces off MAs).
- Generate buy/sell signals (e.g., Golden Cross & Death Cross).
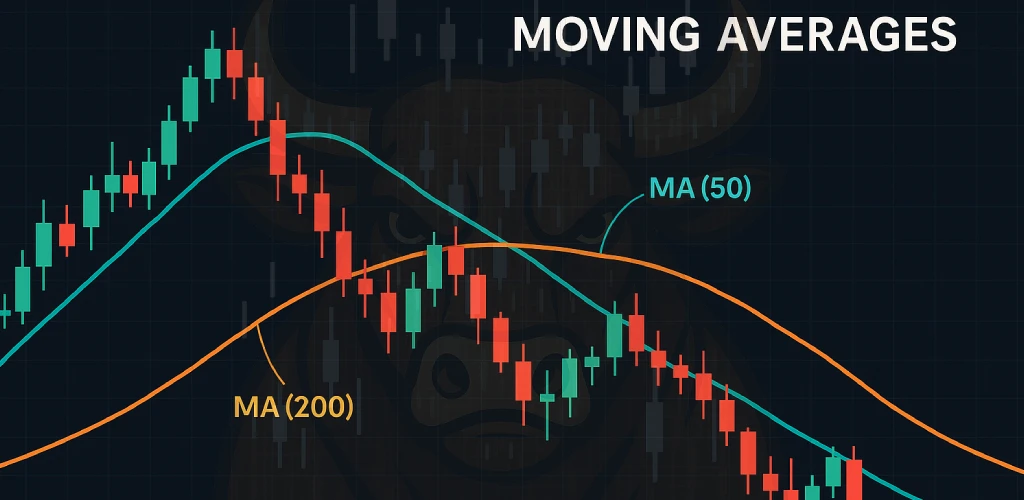
🟢 Golden Cross vs. 🔴 Death Cross
| Signal | Definition | Meaning |
|---|---|---|
| Golden Cross | 50-day MA crosses above 200-day MA | Bullish signal (Buy) |
| Death Cross | 50-day MA crosses below 200-day MA | Bearish signal (Sell) |
📌 Pro Tip: Many traders combine SMA (long-term) and EMA (short-term) for better accuracy.
📉 Other Real-World Applications
Moving averages aren’t just for stocks! They’re also used in:
🌡️ Weather Forecasting
- Helps predict temperature trends by smoothing daily fluctuations.
📊 Business & Sales
- Tracks average monthly revenue to identify growth patterns.
🏭 Manufacturing
- Monitors production efficiency over time.
🧮 How to Calculate Moving Averages (Step-by-Step)
Calculating SMA (Example: 5-Day SMA)
| Day | Closing Price | Calculation | SMA Value |
|---|---|---|---|
| 1 | $10 | – | – |
| 2 | $12 | – | – |
| 3 | $11 | – | – |
| 4 | $13 | – | – |
| 5 | $14 | (10+12+11+13+14)/5 | $12 |
| 6 | $15 | (12+11+13+14+15)/5 | $13 |
Calculating EMA (Example: 5-Day EMA)
- First EMA = SMA (since no prior EMA exists).
- Multiplier = 2 / (5 + 1) = 0.33.
- Next EMA = (Latest Price × 0.33) + (Previous EMA × 0.67).
(Note: EMA requires more steps, so many traders use software.)
🚀 Advanced Tips for Using Moving Averages
🔹 Combine different timeframes (e.g., 20-day & 50-day MA for better signals).
🔹 Use with other indicators (RSI, MACD) to confirm trends.
🔹 Adjust periods – Shorter MAs (5, 10) for day trading; longer (50, 200) for investing.
❓ Frequently Asked Questions (FAQs)
❔ Which is better: SMA or EMA?
- SMA is better for long-term trends.
- EMA is better for short-term trading.
❔ What’s the best period for moving averages?
- Depends on your strategy!
- Day traders: 5, 10, 20 periods.
- Swing traders: 50, 100 periods.
- Investors: 200 periods.
❔ Can moving averages predict future prices?
- No, but they help identify trends and potential reversals.
🔑 Key Takeaways
✔ Moving averages smooth out data to reveal trends.
✔ SMA = Simple average | EMA = Weighted (more recent emphasis).
✔ Used in trading, weather, business, and more.
✔ Golden Cross (bullish) & Death Cross (bearish) are key signals.
📢 Final Thoughts
Moving averages are one of the most powerful yet simple tools for trend analysis. Whether you’re trading stocks, forecasting sales, or just analyzing data, understanding MAs can give you a huge edge.
💡 Now it’s your turn! Try plotting a moving average on a stock chart and see how it behaves.
Recommended Reading
Guide to Volume Price Analysis by Anna Coulling
Technical Analysis of the Financial Markets by John J. Murphy

An impressive share, I simply given this onto a colleague who was doing a little analysis on this. And he in reality bought me breakfast as a result of I found it for him.. smile. So let me reword that: Thnx for the deal with! However yeah Thnkx for spending the time to discuss this, I feel strongly about it and love studying more on this topic. If possible, as you turn into experience, would you mind updating your weblog with more particulars? It’s extremely useful for me. Large thumb up for this blog put up!