What is a Head and Shoulders Pattern and Inverse? The Ultimate Reversal Signal
Learn how to identify & trade the Head and Shoulders pattern—one of the most reliable reversal signals in trading. Includes examples, strategies, and common pitfalls.
🔍 📉📈 The Head and Shoulders (H&S) pattern is one of the most powerful reversal signals in trading, appearing at market tops (bearish H&S) or bottoms (inverse H&S). This classic chart formation consists of three peaks (left shoulder, head, right shoulder) and a neckline breakout, offering traders high-probability entry points. Whether you’re trading stocks, forex, or crypto, mastering both the standard and inverse H&S patterns can help you spot major trend changes before they happen. In this guide, we’ll break down how to identify, confirm, and trade these patterns like a pro.
In this complete guide, you’ll learn:
✅ What the Head and Shoulders pattern looks like
✅ **How to identify it **
✅ Bullish vs. Bearish H&S differences
✅ Step-by-step trading strategy
✅ Common mistakes to avoid
👤 What is a Head and Shoulders Pattern?
The Head and Shoulders (H&S) is a trend reversal pattern that signals a potential shift from:
- Uptrend → Downtrend (Classic H&S)
- Downtrend → Uptrend (Inverse H&S)
It consists of three peaks:
- Left Shoulder – A high followed by a pullback.
- Head – A higher high (With a volume lower than or equal to the first shoulder), then a deeper pullback.
- Right Shoulder – A lower high (matching the left shoulder With a volume equal to the head or even lower), before breaking down.
📌 Key Feature: The neckline (support/resistance line connecting pullbacks) acts as the final confirmation level “Like in the first image”.
📉 How to Spot a Valid H&S Pattern
1. Classic (Bearish) Head & Shoulders
🔹 Forms after an uptrend (signals reversal to downtrend).
🔹 Structure:
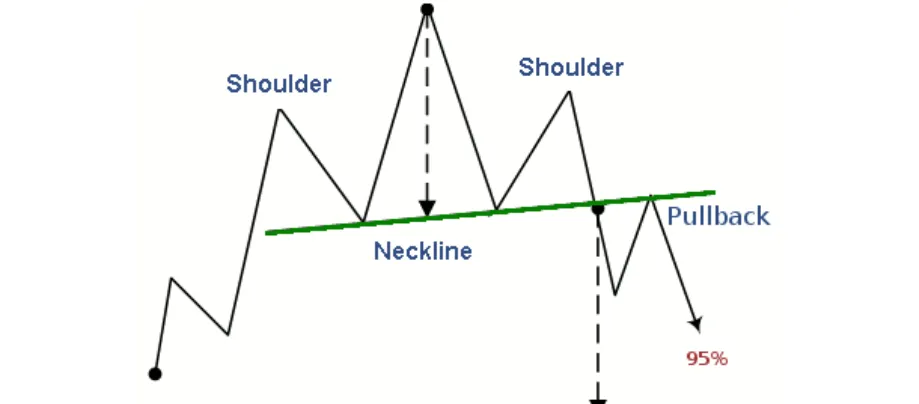
- Left Shoulder = First peak, then pullback.
- Head = Higher peak, then deeper pullback.
- Right Shoulder = Lower peak (similar to left shoulder).
🔹 Neckline Break = Sell signal (confirms downtrend).
2. Inverse (Bullish) Head & Shoulders
🔹 Forms after a downtrend (signals reversal to uptrend).
🔹 Structure:
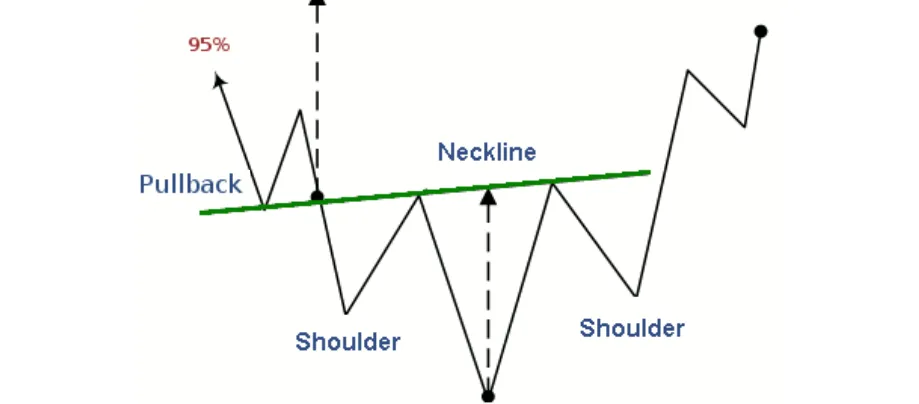
- Left Shoulder = First low, then bounce.
- Head = Lower low, then stronger bounce.
- Right Shoulder = Higher low (mirrors left shoulder).
🔹 Neckline Break = Buy signal (confirms uptrend).
📌 Pro Tip: The pattern is only valid if the neckline is broken with conviction (strong candle close & volume).
🎯 How to Trade the H&S Pattern (Step-by-Step)
Step 1: Identify the Pattern
✔ Classic H&S = After an uptrend.
✔ Inverse H&S = After a downtrend.
Step 2: Draw the Neckline
- Connect the lowest pullbacks (for classic H&S).
- Connect the highest bounces (for inverse H&S).
Step 3: Wait for the Breakout
- Classic H&S: Enter short after the neckline breaks.
- Inverse H&S: Enter long after the neckline breaks.
Step 4: Set Stop-Loss & Take Profit
- Stop-Loss: Above the right shoulder (bearish) or below it (bullish).
- Take Profit: Measure the head-to-neckline height and project it downward (bearish) or upward (bullish).
📌 Example: If the head is $100 and the neckline is $90, the target is $80 ($100 – $90 = $10 drop projected).
⚠️ Common Mistakes to Avoid
❌ Trading Before Confirmation – Never act until the neckline breaks!
❌ Ignoring Volume – A real breakout should have increasing volume.
❌ Forcing the Pattern – Not every triple-top/bottom is an H&S.
🔍 H&S vs. Other Reversal Patterns
| Feature | Head & Shoulders | Double Top/Bottom | Triple Top/Bottom |
|---|---|---|---|
| Peaks | 3 (L-Sh, H, R-Sh) | 2 similar highs/lows | 3 similar highs/lows |
| Neckline? | ✅ Yes | ✅ Yes | ✅ Yes |
| Strength | ⭐⭐⭐⭐ Strong | ⭐⭐⭐ Reliable | ⭐⭐⭐ Reliable |
📌 Key Takeaways
✔ H&S signals trend reversals (bearish after uptrend, bullish after downtrend).
✔ Neckline break = Confirmation (always wait for it!).
✔ Measure the head height for profit targets.
✔ Avoid false signals by checking volume & trend context.
Now it’s your turn! Open a chart and practice spotting H&S patterns. The more you train your eye, the better your trades will be. 🚀
Recommended Reading
Guide to Volume Price Analysis by Anna Coulling
Technical Analysis of the Financial Markets by John J. Murphy