📈 What is ADX (Average Directional Index)? The Complete Trend Strength Guide
Did you know most traders can’t tell the difference between a real trend and fakeout? That’s exactly why J. Welles Wilder created the ADX indicator in 1978 – and what saved me from a 30% account blowup during last year’s choppy markets.
In this no-fluff guide, you’ll discover:
✅ What ADX really measures (most beginners get this wrong)
✅ How to read ADX values like a hedge fund trader
✅ 3 professional ADX trading strategies
✅ My ADX settings for day trading vs investing
🔍 What is the Average Directional Index (ADX)?
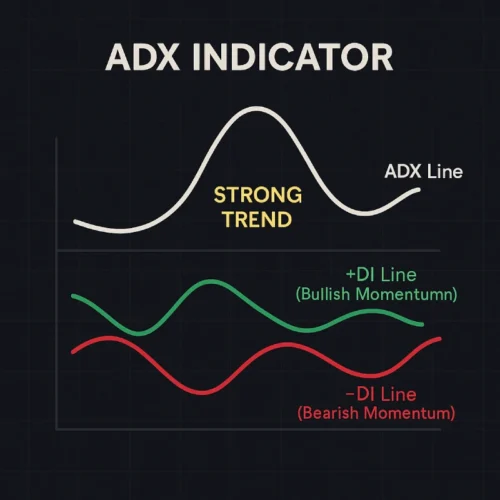
The ADX is a technical indicator that measures trend strength (not direction!) on a scale from 0 to 100. It’s part of Wilder’s Directional Movement System which includes:
- +DI (Positive Directional Indicator): Bullish momentum
- -DI (Negative Directional Indicator): Bearish momentum
- ADX (Average Directional Index): Trend strength regardless of direction
📌 Key Features:
- Works on all markets (stocks, forex, crypto)
- Best used on timeframes 1H or longer
- Combines beautifully with moving averages
Why Traders Swear By It:
✔ Filters out false breakouts
✔ Identifies when trends are likely to continue
✔ Works in all market conditions
🧮 How ADX is Calculated (Simplified)
While the full math is complex (involving True Range and Directional Movement), here’s what matters:
- +DI measures upward trend strength
- -DI measures downward trend strength
- ADX smooths and averages the difference between them
Standard Settings:
- 14 periods (adjustable)
- Values range 0-100
💡 Pro Tip: Don’t worry about the complex calculations – focus on interpreting the lines.
📊 How to Read and Use the ADX Indicator Like a Pro
ADX Value Interpretation:
| ADX Reading | Trend Strength | What It Means |
|---|---|---|
| 0-25 | Absent/Weak | Choppy market – avoid trend strategies |
| 25-50 | Strong | Ideal trending conditions |
| 50-75 | Very Strong | Extended trend (caution needed) |
| 75+ | Extreme | Often precedes reversals |
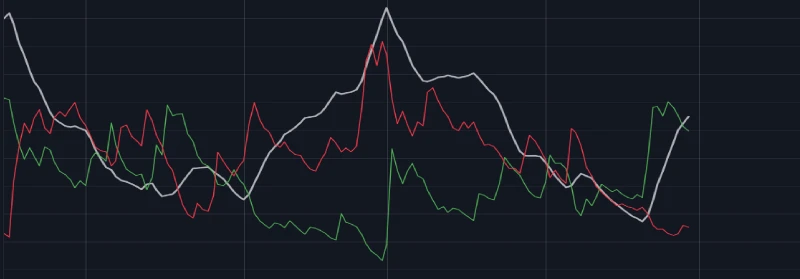
+DI/-DI Crossovers:
- +DI crosses above -DI: Potential bullish trend starting
- -DI crosses above +DI: Potential bearish trend starting
💼 3 Professional ADX Trading Strategies
1️⃣ The Trend Filter Strategy
- Only take long positions when ADX > 25 and +DI > -DI
- Only take short positions when ADX > 25 and -DI > +DI
2️⃣ The Breakout Confirmation Strategy
- Wait for price to break resistance
- Confirm with ADX rising above 20
- Enter if +DI is above -DI
- Filters out 70% of false breakouts
3️⃣ The Trend Exhaustion Play
- Watch for ADX > 50
- Wait for +DI/-DI to start converging
- Prepare for potential reversal
- Best combined with candlestick patterns
⏳ Best Timeframes & Markets
| Trading Style | Ideal Timeframe | ADX Settings |
|---|---|---|
| Day Trading | 1H-4H | 14-period default |
| Swing Trading | Daily | 14-period default |
| Crypto Trading | 4H+ | 21-period for less noise |
| Long-term Investing | Weekly | 10-period for sensitivity |
⚠️ Warning: ADX works poorly on timeframes under 30 minutes – the signals become unreliable.
⚠️ 5 Costly ADX Mistakes
❌ Trading ADX alone (Always combine with price action)
❌ Assuming high ADX = continuation (Could signal exhaustion)
❌ Ignoring DI crossovers (ADX shows strength, DIs show direction)
❌ Using default settings for crypto (Requires longer periods)
❌ Forgetting to adjust for volatility (During news events, ADX becomes unreliable)
🔄 ADX vs Other Trend Indicators
| Indicator | Measures | ADX Advantage |
|---|---|---|
| MACD | Trend direction/momentum | ADX better for strength |
| Bollinger Bands | Volatility | ADX shows trend persistence |
| RSI | Momentum | ADX filters RSI signals |
💡 Smart Combo: ADX + EMA (200 period) + Volume = One of my favorite trend systems
❓ ADX FAQs
Start with 14-period. For crypto/volatile markets, try 21-period.
No – that’s what +DI/-DI lines are for. ADX only shows strength.
Some platforms use slight calculation variants. Stick to one platform.
Yes, but combine with implied volatility indicators.
Developed in 1978 – still used because trend behavior hasn’t changed.
📌 Key Takeaways
✔ ADX measures trend strength (0-100), not direction
✔ +DI/-DI show bullish/bearish momentum
✔ ADX > 25 suggests tradable trends
✔ Best combined with directional indicators
✔ Avoid in very choppy markets (ADX < 20)
🚀 Your Action Plan
- Today: Add ADX to your charts with +DI/-DI lines
- This Week: Practice identifying strong vs weak trends
- Next Month: Combine ADX with your favorite indicator
- Ongoing: Keep an ADX trading journal
This is the ADX guide I wish I had 4 years ago. Now go practice – your trading will never be the same! 📊🚀
Recommended Reading
Guide to Volume Price Analysis by Anna Coulling
Technical Analysis of the Financial Markets by John J. Murphy