📊 What is P/E Ratio? A Complete Guide for Investors
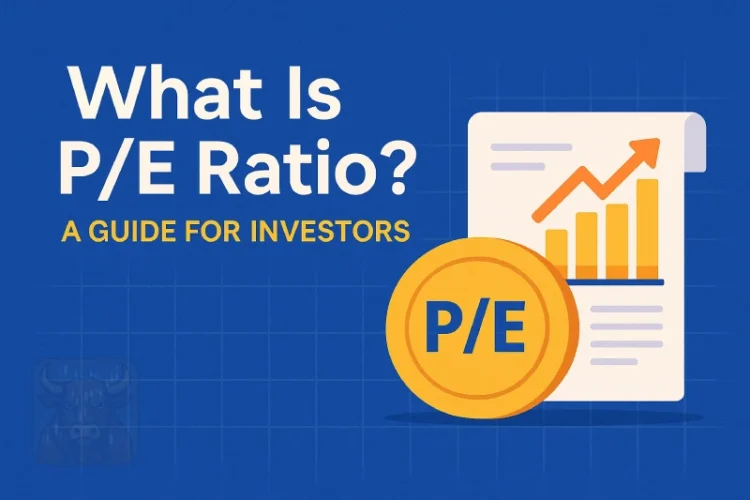
If you’re investing in stocks, you’ve probably heard of the P/E ratio—one of the most widely used valuation metrics in the stock market. But what exactly does it mean, and how can you use it to make better investment decisions?
In this guide, we’ll break down:
✅ What the P/E ratio is
✅ How to calculate it
✅ Different types of P/E ratios
✅ What a “good” P/E ratio looks like
✅ Limitations of the P/E ratio
By the end, you’ll understand how to use this key metric to evaluate stocks like a pro.
📌 What is the P/E Ratio? (Definition & Meaning)
The Price-to-Earnings (P/E) ratio measures how much investors are willing to pay for a company’s earnings. In simple terms:
🔹 P = Stock Price (what the market is valuing the stock at)
🔹 E = Earnings per Share (EPS) (how much profit the company makes per share)
📐 P/E Ratio Formula
P/e Ratio=           Stock price
                 -----------------------
                Earnings Per Share (EPS)
Example:
- If a stock trades at $100 per share and its EPS is $5, its P/E ratio is 20 ($100 ÷ $5).
This means investors are willing to pay $20 for every $1 of annual earnings per share the company generates.
These days, you don’t really need to do the math to get the P/E ratio most brokers or finance websites give it to you automatically.
Still, it’s always good to know how that number actually comes together.
📊 Why Does the P/E Ratio Matter?
The P/E ratio helps investors determine:
✅ Whether a stock is overvalued or undervalued
✅ How a company compares to competitors
✅ Market expectations for future growth
Generally:
- High P/E → Investors expect strong future growth (e.g., tech stocks).
- Low P/E → The stock may be undervalued or facing challenges (e.g., value stocks).
🔍 Types of P/E Ratios
1️⃣ Trailing P/E Ratio
- Uses past 12 months of earnings.
- More reliable since it’s based on actual data.
2️⃣ Forward P/E Ratio
- Based on estimated future earnings.
- Useful for growth stocks but less accurate.
3️⃣ Shiller P/E (CAPE Ratio)
- Adjusts for economic cycles using 10-year average earnings.
- Popular for assessing overall market valuation.
📈 What is a “Good” P/E Ratio?
There’s no universally ‘good’ P/E ratio—it depends heavily on the company’s sector, growth stage, and the overall market environment, but here’s a general guideline:
| P/E Range | Interpretation | Example Stocks |
|---|---|---|
| <15 | Undervalued or slow growth | Utility stocks, banks |
| 15-25 | Fairly valued, stable growth | Blue-chip companies |
| >25 | High growth expected | Tech stocks (e.g., Tesla, Amazon) |
⚠️ Important: Always compare P/E ratios within the same industry—tech stocks naturally have higher P/Es than banks.
⚖️ Pros & Cons of Using P/E Ratio
✅ Advantages
✔ Simple & widely used – Easy to calculate and compare.
✔ Helps spot over/undervalued stocks – Identifies potential bargains.
✔ Reflects market sentiment – High P/E = high growth expectations.
❌ Limitations
✖ Earnings can be manipulated – Companies may adjust accounting methods.
✖ Doesn’t account for debt – A company with high debt may look cheap.
✖ Cannot be used when companies have negative earnings, which is common with startups or early-stage growth companies – No earnings = no P/E ratio.
📊 How to Use P/E Ratio in Stock Analysis
1️⃣ Compare to Industry Peers
- A P/E of 30 might be high for a bank but normal for a tech company.
2️⃣ Track Historical P/E Trends
- Is the stock trading at a higher/lower P/E than its 5-year average?
3️⃣ Combine with Other Metrics
- PEG Ratio (P/E ÷ Earnings Growth) – Better for growth stocks.
- P/B Ratio (Price-to-Book) – Useful for asset-heavy companies.
📉 Real-World P/E Ratio Examples
| Company | P/E Ratio (2024) | Industry Avg. | Verdict |
|---|---|---|---|
| Apple (AAPL) | 28 | 25 | Slightly overvalued |
| JPMorgan (JPM) | 12 | 14 | Undervalued |
| Tesla (TSLA) | 60 | 30 | Highly overvalued |
P/E ratios as of early 2024 – these can fluctuate with earnings reports and market sentiment
🎯 Final Thoughts: Should You Rely on P/E Ratio?
The P/E ratio is a great starting point for stock analysis, but it shouldn’t be the only metric you use. Always consider:
✔ Industry standards
✔ Company growth prospects
✔ Debt levels & cash flow
By combining P/E with other tools, you’ll make smarter investment decisions.
This guide covers everything beginners need to know about the P/E ratio. Bookmark this page for quick reference! 🚀
📌 Key Takeaways:
- P/E ratio = Stock Price ÷ Earnings Per Share (EPS)
- High P/E = Growth expectations | Low P/E = Potential value
- Compare P/E within the same industry for accuracy
- Use alongside other metrics for better analysis
Now that you understand P/E ratios, you’re one step closer to becoming a smarter investor! 💡


