📈 What is RSI in Trading? A Beginner’s Guide to the Relative Strength Index
If you’re exploring technical analysis and want to understand how traders spot momentum shifts and potential reversals, the Relative Strength Index (RSI) is one of the most widely used indicators for the job. In this complete guide, I will explain to you through everything you need to know about RSI, from its core definition to practical strategies and common pitfalls.
In this guide, we’ll cover:
✅ What RSI is and why traders use it
✅ How RSI is calculated (simple explanation)
✅ How to read RSI for signals
✅ Popular RSI trading strategies
✅ Mistakes to avoid with RSI
✅How to use RSI in different markets (stocks, forex, crypto)
By the end, you’ll be able to read RSI with confidence and start applying it to your own trades. Let’s dive in!
🔍 What is RSI? (Simple Definition)
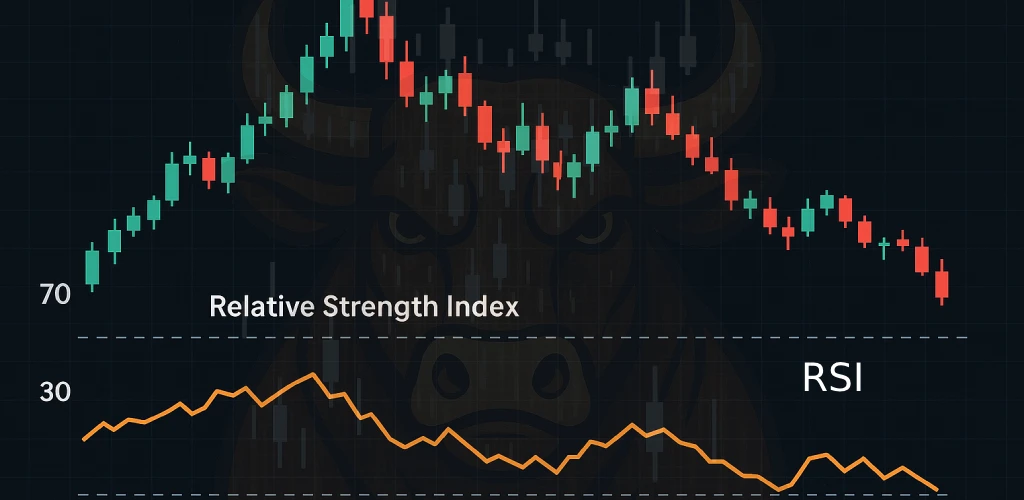
The Relative Strength Index (RSI) is a momentum oscillator used in technical analysis. It measures the speed and magnitude of recent price changes to evaluate whether a market is overbought or oversold.
RSI values range from 0 to 100
✔ A reading above 70 = Overbought (price may pull back)
✔ A reading below 30 = Oversold (price may bounce)
📌 Developed by: J. Welles Wilder Jr. in 1978.
📌 Standard setting: 14-period RSI (used by default on most platforms like TradingView or MetaTrader).
🌟Why Traders Use RSI
🔹 Identify trend reversals before they happen
🔹 Time entries and exits more effectively
🔹 Avoid emotional decisions by relying on data
🔹Confirm other technical indicators like MACD or moving averages
📊 How is RSI Calculated?
The RSI formula compares recent gains to recent losses, don’t worry, you don’t need to be a math genius to understand RSI. Here’s a simplified version of the formula:
RSI Formula:
RSI = 100 – [100 / (1 + RS)] Where RS = Average Gain / Average Loss
Step-by-Step Breakdown:
- Pick a period (default is 14 days)
- Calculate average gain & average loss during those 14 days
- Divide average gain by average loss to get RS
- Plug RS into the formula above
📌 Example: If a stock’s average gain over 14 days is $2 and the average loss is $1, then:
RSI = 100 – [100 / (1 + (2/1))] = 66.67 No worries—most platforms calculate RSI automatically (thank God for that!).
📈 How to Read RSI (Key Levels & Signals)
1️⃣ Overbought & Oversold Zones
| RSI Level | Market Condition | What It Means |
|---|---|---|
| 70+ | Overbought | Price may reverse downward (sell signal) |
| 30- | Oversold | Price may reverse upward (buy signal) |
⚠️ Warning: RSI can stay in overbought/oversold for extended periods in strong trends. Use it with caution and combine with other signals.
2️⃣ RSI Divergence
🔹 Bearish Divergence: Price makes higher highs, RSI makes lower highs → Reversal possible
🔹 Bullish Divergence: Price makes lower lows, RSI makes higher lows → Potential bounce
3️⃣ RSI and the Centerline (50)
RSI above 50 typically indicates that average gains are outpacing losses, supporting bullish momentum
- RSI > 50 → Bullish momentum.
- RSI < 50 → Bearish momentum.
💡 Top RSI Trading Strategies
1️⃣ Classic RSI Bounce Strategy
- Buy when RSI crosses above 30 (oversold bounce).
- Sell when RSI crosses below 70 (overbought pullback).
📌 Best for: Works best in sideways or range-bound markets
2️⃣ RSI Divergence Strategy
- Look for price & RSI moving in opposite directions.
- Example: If price hits a new high, but RSI doesn’t → Possible reversal.
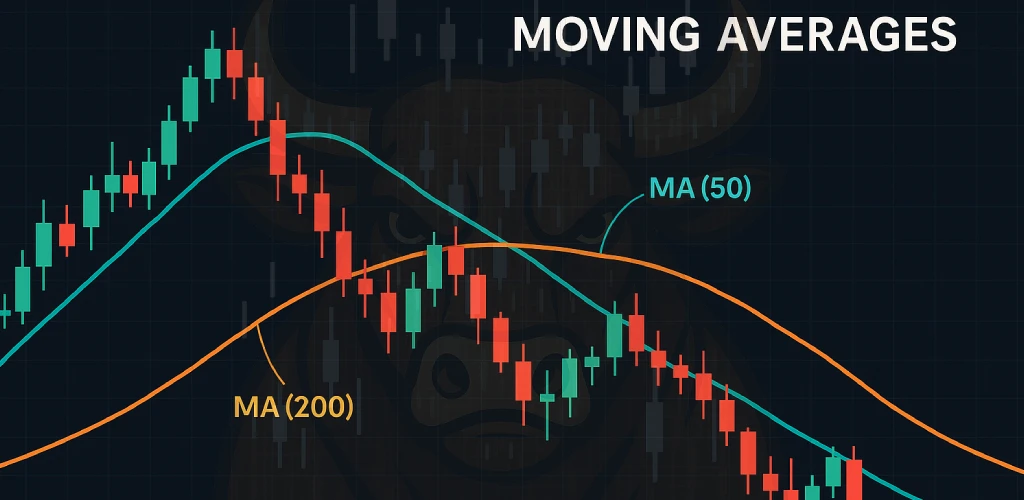
3️⃣ RSI + Moving Averages (Confirmation)
- Use RSI for entry and MA for trend direction.
- Example: Buy only if RSI > 30 and price is above 200-day MA.
⚠️ Common RSI Mistakes to Avoid
❌ Trading overbought/oversold blindly in strong trends (RSI can stay extreme in bull/bear markets).
❌ Using RSI alone (always pair with trend analysis or volume).
❌ Ignoring timeframes (RSI on a 5-min chart behaves differently than on a daily chart).
📉 RSI in Different Markets
📊 Stocks
- Works well for large-cap stocks (Apple, Tesla).
- Less effective with small-cap or low-volume stocks
💰 Forex
- Best in ranging markets (EUR/USD, GBP/USD).
- May give false signals during news events.
₿ Crypto
- Highly volatile → RSI can give frequent false signals.
- Works better on higher timeframes (4H, Daily).
🔧 Adjusting RSI Settings for Better Accuracy
The default 14-period RSI works for most traders, but you can tweak it:
- Shorter periods (7-9) → More sensitive, more signals (good for day trading).
- Longer periods (21-25) → Smoother, fewer false signals (good for swing trading).
📌 Pro Tip: Test different settings in a demo account first!
❓ RSI Trading FAQs
❔ What’s the best RSI strategy for beginners?
Start with the classic overbought/oversold strategy in sideways markets.
❔ Can RSI be used for long-term investing?
Yes, but use higher timeframes (weekly/monthly charts) to filter noise.
❔ Why does RSI sometimes give false signals?
Because it’s a lagging indicator—always confirm with price action & volume.
❔ What’s the difference between RSI and MACD?
- RSI measures momentum (overbought/oversold).
- MACD measures trend strength & direction.
🏆 Key Takeaways
✔ RSI is a momentum oscillator (0-100) that spots overbought/oversold conditions.
✔ RSI > 70 = Overbought (sell signal) | RSI < 30 = Oversold (buy signal).
✔ Divergence can warn of trend reversals before they happen.
✔ Best used with other indicators (moving averages, trendlines).
🚀 Final Thoughts
RSI is one of the most powerful yet simple tools for traders. Whether you’re a day trader, swing trader, or investor, mastering RSI can help you make smarter, data-driven decisions.
💡 Next Step: Open a chart, add RSI, and see how it responds to real market movement.
Recommended Reading
Guide to Volume Price Analysis by Anna Coulling
Technical Analysis of the Financial Markets by John J. Murphy