📊 What is the OBV Indicator in Trading? The Complete On-Balance Volume Guide
Did you know that 90% of traders overlook one of the most powerful yet simple indicators? The OBV (On-Balance Volume) might be hiding in your trading platform right now – and it could reveal game-changing market insights most traders miss.
In this comprehensive guide, we’ll unpack:
✅ What OBV is and why it’s called the “smart money tracker”
✅ The exact OBV formula (with real chart examples)
✅ 3 professional OBV trading strategies
✅ How to spot divergences before price moves
✅ Common OBV mistakes that cost traders money
By the end, you’ll know how to use OBV like hedge funds do – to spot accumulation, distribution, and major trend changes. Let’s dive in!
🔍 What is the OBV Indicator?
The OBV (On-Balance Volume) is a technical indicator that uses volume to predict price movements. It adds volume when price rises and subtracts when it falls, showing whether smart money is buying or selling. Developed by Joseph Granville in 1963, it operates on a simple premise:
“Volume precedes price.”
📌 Key Features:
- Measures buying/selling pressure
- Tracks cumulative volume (not just price)
- Works across all markets (stocks, forex, crypto)
Why Traders Love OBV:
✔ Early reversal signals (spots trends before price reacts)
✔ Confirms breakouts (real vs fake moves)
✔ Simple interpretation (no complex math needed)
🧮 How OBV is Calculated (The Exact Formula)
The OBV calculation follows strict rules:
If Today's Close > Yesterday's Close:
  OBV = Previous OBV + Today's Volume

If Today's Close < Yesterday's Close:
  OBV = Previous OBV - Today's Volume

If Today's Close = Yesterday's Close:
  OBV remains unchanged
📊 Real-World Example:
| Day | Close Price | Volume | OBV Calculation | OBV |
|---|---|---|---|---|
| 1 | $50 | 10,000 | – | 10,000 |
| 2 | $52 | 15,000 | 10,000 + 15,000 | 25,000 |
| 3 | $51 | 12,000 | 25,000 – 12,000 | 13,000 |
💡 Pro Tip: You don’t need to calculate manually – TradingView, ThinkorSwim, and other platforms do it automatically.
📈 How to Read OBV Like a Pro
1️⃣ OBV Trend Analysis
- Rising OBV = Accumulation (bullish)
- Falling OBV = Distribution (bearish)
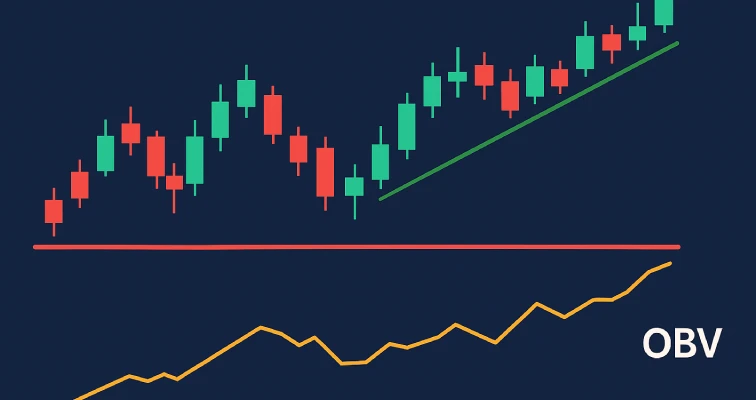
2️⃣ OBV Breakouts
When OBV breaks its own trendline before price does → Strong signal
3️⃣ OBV Divergences
| Type | Price Action | OBV Action | Signal |
|---|---|---|---|
| Bullish Divergence | Lower Lows | Higher Lows | Upcoming Rally |
| Bearish Divergence | Higher Highs | Lower Highs | Potential Drop |
💼 3 Professional OBV Strategies
1️⃣ The Trend Confirmation Method
- Long when: Price ↑ & OBV ↑
- Short when: Price ↓ & OBV ↓
- Best for: Swing traders
2️⃣ The Breakout Fakeout Filter
- Only trade breakouts where OBV confirms
- Rejects 60% of false breakouts
3️⃣ The Institutional Accumulation Spotter
- Look for rising OBV during pullbacks
- Shows “smart money” buying dips
⏳ Best Timeframes for OBV
| Trading Style | Ideal Timeframe | Why? |
|---|---|---|
| Scalping | 5-15 min | Needs volume data granularity |
| Day Trading | 30 min-1H | Balances noise and signals |
| Swing Trading | 4H-Daily | Most reliable for OBV |
| Investing | Weekly | Shows major accumulation |
⚠️ Warning: OBV works poorly on illiquid stocks or low-volume cryptos.
⚠️ 5 Costly OBV Mistakes
❌ Ignoring volume spikes (huge OBV moves matter most)
❌ Trading OBV alone (always pair with price action)
❌ Using on inconsistent volume assets (some forex pairs)
❌ Overlooking multi-timeframe OBV (check higher TFs)
❌ Misreading divergences (wait for confirmation)
🔄 OBV vs Other Volume Indicators
| Indicator | Measures | OBV Advantage |
|---|---|---|
| Volume Bars | Raw volume | OBV shows cumulative flow |
| VWAP | Volume-weighted price | OBV simpler for trends |
| Money Flow Index | Volume + price | OBV better for long-term |
💡 Smart Combo: OBV + 200 EMA + RSI = Powerful system.
❓ OBV Indicator FAQs
The classic setting (no changes) works best for most traders.
Yes, but only on high-volume coins (BTC, ETH). Avoid low-cap altcoins.
No – it shows probability, not certainty. Always use stop losses.
Some platforms use slight calculation variants. Stick to one platform.
Created in 1963 – still relevant because volume never lies.
📌 Key Takeaways
✔ OBV tracks “smart money” flow through volume
✔ Rising OBV = Bullish, Falling OBV = Bearish
✔ Divergences often precede big moves
✔ Best for liquid stocks and major forex pairs
✔ Always confirm with price action
🚀 Next Steps: How to Start Using OBV Today
- Open your trading platform and add OBV
- Analyze 5 past trades – would OBV have helped?
- Paper trade the 3 strategies above
- Combine OBV with your existing system
💡 Pro Tip: Bookmark this guide – OBV takes practice to master! The OBV might just become your new secret weapon.
Recommended Reading
Guide to Volume Price Analysis by Anna Coulling
Technical Analysis of the Financial Markets by John J. Murphy