Why is Volume So Important in Trading?
📊 Volume is the lifeblood of trading—it reveals the strength behind price movements, confirms trends, and exposes potential reversals. As Anna Coulling explains in her groundbreaking book “A Complete Guide to Volume Price Analysis,” ignoring volume is like driving blindfolded.
we’ll explore:
✅ What volume is & why it matters
✅ How to interpret volume spikes, divergences, and trends
✅ Volume Price Analysis (VPA) techniques
✅ Common mistakes traders make
🔍 What is Trading Volume?
Volume measures the number of shares, contracts, or units traded in a security during a given period. It answers:
✔ How many buyers/sellers participated?
✔ Was the move strong or weak?
📌 Key Insight (Anna Coulling’s Core Principle):
“Price is a function of volume. Without volume, price cannot move.”
📈 Why Volume Matters: 5 Critical Roles
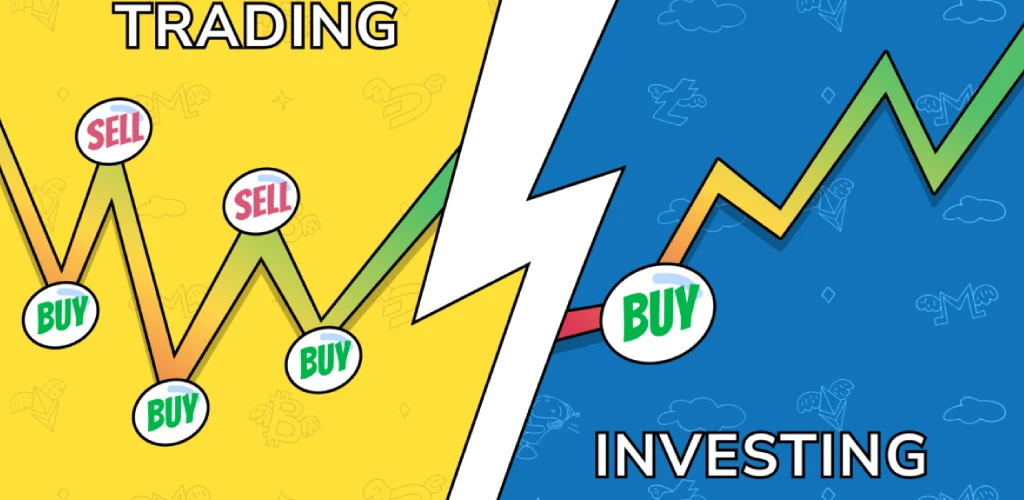
1️⃣ Confirms Trend Strength
Bullish Example: Rising price + Rising volume = Strong uptrend.
Bearish Example: Falling price + Rising volume = Strong downtrend.
📉 Warning: If prices rise on low volume, the trend may be weak (fakeout likely).
2️⃣ Spots Reversals Early
Volume Divergence = Price and volume disagree:
- Price makes new highs, but volume declines → Bullish exhaustion.
- Price makes new lows, but volume dries up → Bearish exhaustion.
📌 Pro Tip (Coulling’s Rule):
“At market tops, volume fades. At market bottoms, volume surges.”
3️⃣ Validates Breakouts & Breakdowns
- High-volume breakouts = More likely to sustain.
- Low-volume breakouts = Higher chance of failure.
📊 Example: A stock breaking resistance on 2x average volume has strong conviction.
4️⃣ Identifies Accumulation/Distribution
- Rising volume + sideways price = Smart money accumulating.
- Spiking volume + sharp drops = Distribution (big players exiting).
5️⃣ Filters False Signals
- Doji candle with low volume? Likely noise.
- Hammer candle with high volume? Potentially significant.
📚 Anna Coulling’s Volume Price Analysis (VPA) Framework
Coulling’s VPA method combines volume + candlestick patterns for high-probability trades.
1. Volume Climax (Exhaustion Moves)
- Blow-off top = Ultra-high volume + parabolic price → Reversal imminent.
- Selling climax = Panic selling on massive volume → Bottom near.
2. Volume and Support/Resistance
- Volume “nodes” at key levels show where big players trade.
- Low-volume retests of support/resistance often fail.
3. Volume vs. Price Spread
- Narrow spread (small candle) + High volume = Potential breakout brewing.
- Wide spread (large candle) + Low volume = Caution (weak participation).
📉 Real-World Volume Analysis Examples
Example 1: Stock (Apple Inc.)
- Breakout: AAPL gaps up on 300% avg. volume → Rally continues for weeks.
- Divergence: New high with declining volume → Reverses within days.
Example 2: Forex (EUR/USD)
- False breakout: EUR/USD pierces resistance on thin volume → Fails.
- Valid breakout: Surges past 1.1000 on surge in futures volume.
Example 3: Crypto (Bitcoin)
- Bull trap: BTC rallies to $48K on falling volume → Crashes 30%.
- Bottoming signal: BTC dumps to $16K on record volume → Reverses into bull market.
🎯 How to Trade Using Volume (Step-by-Step)
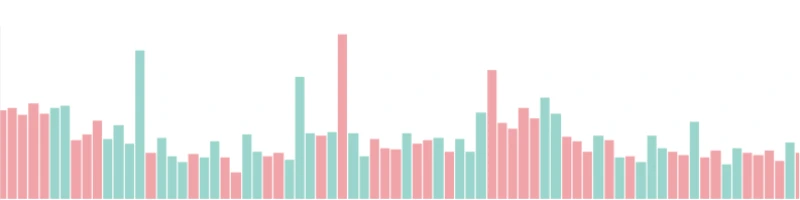
Step 1: Set Up Your Charts
- Add volume bars (below price chart).
- TradingView includes it by default..
Step 2: Analyze Volume Trends
- Compare current volume to 3-month average.
- Watch for spikes, divergences, or contractions.
Step 3: Combine with Price Action
- High volume + breakout candle = Enter.
- Low volume + indecision candle = Avoid.
Step 4: Manage Risk
- Stop-loss: Below low-volume pullbacks.
- Take-profit: At volume-based resistance.
⚠️ 5 Common Volume Trading Mistakes
❌ Ignoring Relative Volume – A “high volume” day for a stock may be normal for a crypto.
❌ Chasing Low-Volume Breakouts – Most fail.
❌ Overlooking Volume Divergences – Early reversal signals.
❌ Misinterpreting News Volume – Earnings spikes often reverse.
❌ Using Volume Alone – Always pair with price action.
📊 Volume Indicators to Use
| Indicator | Best For | Coulling’s View |
|---|---|---|
| OBV (On-Balance Volume) | Trend confirmation | 👍 Recommends |
| VWAP (Volume-Weighted Avg. Price) | Intraday trading | 👍 Essential |
| Volume Profile | Key support/resistance | 👍 Critical |
| Money Flow Index (MFI) | Overbought/oversold | 👎 Less useful |
📌 Key Takeaways
✔ Volume confirms trends – No volume = No conviction.
✔ Divergences signal reversals – Price up + Volume down = Danger.
✔ Breakouts need volume – Low-volume moves often fail.
✔ VPA combines volume + price – The Coulling gold standard.
✔ Avoid rookie mistakes – Context matters (relative volume, timeframes).
Want to master volume? Re-read Anna Coulling’s book, then scan charts daily for volume patterns.
Let me be real with you—Anna Coulling’s Volume Price Analysis book is an absolute game-changer and easily one of my top 3 trading books ever. I’ve leaned on its principles for years, which is why I put together this post breaking down the most powerful concepts (at least the ones that clicked hardest for me).
But fair warning: This is just the tip of the iceberg. Do yourself a favor and grab the actual book—you’ll thank me later.